Memory Leaks Are a Critical Problem
 Memory leaks rank among the most insidious and difficult-to-diagnose issues in C and C++ programming. Unlike garbage-collected languages, here the developer manages memory manually, which gives flexibility and performance – but also requires strict discipline and attention. In large long-running applications applications, such as servers, or desktop clients, memory-management errors eventually lead to performance degradation and increased RAM usage. Left unchecked, this can exhaust system resources, leading to application instability, crashes, or – under extreme conditions – host system failure.
Memory leaks typically arise in the following scenarios:
- Orphaned allocations: Memory is allocated but its pointer is lost, making it impossible to
free()ordelete. - Circular references (in manual management contexts): Objects reference each other in a cycle, preventing timely cleanup when no external owner exists.
- Heap corruption: Buffer overruns or underruns overwrite metadata used by the allocator, which may indirectly cause leaks (e.g., by breaking
free()logic). - Mismatched deallocation: Using
deleteinstead ofdelete[](orfree()on memory allocated withnew), leading to undefined behavior – often manifesting as leaks. - Logical leaks: Objects remain reachable (e.g., in caches or global containers) but are no longer semantically needed.
- Use of uninitialized values: While not a leak per se, this can cause erratic control flow (e.g., skipping cleanup paths), resulting in leaks.
Such defects often evade detection by program logs and static analysis tools. In many cases the application appears to function correctly until it processes a large volume of data, runs for an extended period, or encounters specific edge conditions. Gradual increases in memory usage may hint at a leak, especially when monitored over time, but this signal can be subtle, intermittent, or obscured by environmental factors such as shared infrastructure or background processes. As a result, dynamic memory analysis is not merely beneficial but essential. Every QA engineer working with native code should include a dedicated tool like Valgrind in their testing toolkit.
What Valgrind Is and Why Testers Need It
Valgrind is a dynamic binary instrumentation framework for Linux that executes programs inside a virtualized CPU environment. It requires no source code or recompilation – only a compiled executable. In practice, Valgrind runs the target application in a controlled, sandboxed execution environment where it can inject additional instructions to enable deep runtime analysis, including memory debugging and performance profiling.
Under the hood, Valgrind emulates the host processor. It disassembles each machine instruction, adds instrumentation code, and then interprets the modified instruction stream. This approach grants fine-grained visibility into memory accesses, register states, and system calls – making it exceptionally powerful for detecting subtle memory errors.
Valgrind includes a suite of complementary tools, each designed for a specific aspect of runtime analysis:
- Memcheck – the most widely used tool. It detects memory errors including leaks, invalid heap accesses, use of uninitialized memory, and misuse of system calls.
- Massif – profiles heap memory usage over time, helping identify memory bloat and peak consumption points.
- Callgrind – records function call counts and call graphs, enabling detailed call-path analysis (often used with KCachegrind for visualization).
- Cachegrind – simulates CPU cache behavior and branch prediction, reporting instruction counts, cache hits/misses, and branch misprediction rates.
- Helgrind – detects potential data races and synchronization errors in multithreaded programs, including lock ordering issues and deadlocks.
- DRD – a lighter-weight alternative to Helgrind, optimized for speed at the cost of reduced diagnostic detail.
- DHAT (Dynamic Heap Analysis Tool) – analyzes heap allocation patterns, tracking object lifetimes, read/write access frequency, and spatial/temporal locality.
- Nulgrind – a minimal, no-op tool intended as a template for developing custom Valgrind tools.
- Lackey – a simple instrumentation example that counts memory accesses and instruction executions.
- exp-bbv – an experimental tool for basic block profiling, supporting selective instrumentation of code regions.
Valgrind operates using a technique known as disassembly and re-synthesis. It loads the target application into a process, disassembles its machine code, injects instrumentation logic for analysis, reassembles the modified instructions, and then executes them. To select a specific analysis tool, you use the --tool option before the command. The chosen tool then initializes, loads the client program into the same process, and recompiles the program's code in small blocks using a just-in-time, execution-driven approach.
In effect, Valgrind functions as a runtime abstraction layer between the operating system and the client application. This design enables analysis of closed-source or third-party binaries without requiring source code or recompilation. However, the usefulness of the reports strongly depends on debug symbols. Without them, stack traces and error locations appear as raw memory addresses rather than human-readable function names and source line numbers.
A key innovation in Valgrind is its shadow state mechanism. For every register and memory location used by the client program, Valgrind maintains a corresponding shadow value that holds metadata – for instance, whether the memory is allocated or freed, initialized or uninitialized. As the program executes, Valgrind monitors both the real data and its shadow state during operations such as reads, writes, arithmetic, allocations, deallocations, and system calls. This dual tracking enables precise detection of memory errors, including use-after-free, double-free, out-of-bounds accesses, and operations on undefined values.
Among Valgrind's tools, Memcheck is by far the most widely used. It leverages shadow state to identify memory leaks and a broad range of memory-safety violations. Massif ranks second in popularity, focusing instead on memory usage profiling over time.

Installing Valgrind on Ubuntu and Other Debian-Based Systems
Valgrind can be installed in several ways. The simplest approach is via the system package manager:
sudo apt update && sudo apt install valgrind -yHowever, the version in the default repositories may be outdated. For a more up-to-date release, consider installing Valgrind through Snap:
sudo apt install snap -y
sudo snap install valgrind --classic
valgrind --version
Note: On Ubuntu 24.04 and newer, accurate stack traces – especially inside glibc functions – require debug symbols for the C library. Install them with:
sudo apt install libc6-dbg -yWithout this package, backtraces may show only memory addresses instead of function names and source locations.
Using Memcheck
Memcheck is the primary Valgrind tool used by QA engineers for detecting memory safety issues. It identifies a wide range of problems, including:
- Memory leaks – categorized as definitely lost, possibly lost, or indirectly lost.
- Reads from uninitialized memory.
- Buffer overruns and underruns (writes or reads outside allocated regions).
- Use-after-free errors (accessing memory after it has been deallocated).
- Double-free operations.
- Mismatched or invalid heap management calls – for example, using
free()on memory allocated withnew, ordeleteinstead ofdelete[].
Memcheck is the default tool, so it runs automatically when no --tool option is specified. While Valgrind can analyze stripped binaries, optimal results require a debug build: compile with -g to include debug symbols and avoid compiler optimizations (e.g., -O0). This ensures stack traces map to source locations and memory diagnostics reflect actual program logic rather than optimized or inlined code.
Consider the following minimal C program, which allocates memory but never frees it:
#include <stdlib.h>

int main(void) {
    // Allocate 1 KB
    void *p = malloc(1024);
    // Memory leak: no call to free(p)
    return 0;
}
We compile two versions: one stripped, and one with debug symbols and no optimizations:
gcc leak.c -o leak_stripped
gcc -g -O0 leak.c -o leak_debug
To analyze both binaries, we run Valgrind with a comprehensive Memcheck configuration:
valgrind \
  --leak-check=full \
  --show-leak-kinds=definite,indirect,possible \
  --num-callers=20 \
  --read-var-info=yes \
  --leak-resolution=med \
  --track-origins=yes \
  --log-file=valgrind.%p.log \
./leak_xxx-
Key options explained
--leak-check=full
Enables comprehensive leak detection, reporting the exact allocation site (file and line number, if debug symbols are available).
--show-leak-kinds=definite,indirect,possible
Controls which leak categories to report:
• Definite – blocks with no remaining pointers (100% unrecoverable).
• Indirect – blocks only reachable through definitely lost blocks.
• Possible – blocks where pointers exist but appear unreachable due to pointer arithmetic or type casts.
We omit still reachable leaks – memory that remains accessible at exit (e.g., global caches). While harmless in short-lived programs, such allocations can grow indefinitely in long-running services.
--num-callers=20
Limits stack traces to 20 frames. This depth is typically sufficient for complex C++ or Qt call chains, balancing diagnostic value against log size.
--read-var-info=yes
Includes variable names in diagnostics when debug symbols are present (-g). Instead of raw addresses like0x55a1b2c, you'll see buf,obj->data, orargv[0].
--leak-resolution=med
Groups similar leaks using medium-precision stack matching. This setting offers a practical trade-off: fewer duplicate entries than low, but faster and less verbose than high.
• low – fastest, coarsest grouping
• med – balanced (recommended for most QA workflows)
• high – most precise, but slower and more verbose.
--track-origins=yes
Traces the propagation path of uninitialized values – for instance: "uninitialized value used at line 42 → assigned at line 37 → passed as argument from line 25". This greatly aids root-cause analysis but incurs a 2-5x runtime overhead.
--log-file=valgrind.%p.log
Writes output to a file named with the process ID (%p), keeping Valgrind diagnostics separate from the application's stdout/stderr.
This configuration enables detailed leak classification, deeper stack traces, tracking of uninitialized value origins, and structured logging – essential for thorough QA analysis.
Application-specific arguments (e.g., config paths or input files) go after the binary name.
valgrind [valgrind-options] application [application-options]Running the example produces a leak report like this:
==55100== HEAP SUMMARY:
==55100==     in use at exit: 1,024 bytes in 1 blocks
==55100==   total heap usage: 1 allocs, 0 frees, 1,024 bytes allocated
==55100==
==55100== 1,024 bytes in 1 blocks are definitely lost in loss record 1 of 1
==55100==    at 0x484B80F: malloc (vg_replace_malloc.c:447)
==55100==    by 0x400115E: main (in /home/user/src/leak_stripped)
==55100==
==55100== LEAK SUMMARY:
==55100==    definitely lost: 1,024 bytes in 1 blocks
==55100==    indirectly lost: 0 bytes in 0 blocks
==55100==      possibly lost: 0 bytes in 0 blocks
==55100==    still reachable: 0 bytes in 0 blocks
==55100==         suppressed: 0 bytes in 0 blocks
==65012== HEAP SUMMARY:
==65012==     in use at exit: 1,024 bytes in 1 blocks
==65012==   total heap usage: 1 allocs, 0 frees, 1,024 bytes allocated
==65012==.
==65012== 1,024 bytes in 1 blocks are definitely lost in loss record 1 of 1
==65012==    at 0x484B80F: malloc (vg_replace_malloc.c:447)
==65012==    by 0x400115E: main (leak.c:5)
==65012==
==65012== LEAK SUMMARY:
==65012==    definitely lost: 1,024 bytes in 1 blocks
==65012==    indirectly lost: 0 bytes in 0 blocks
==65012==      possibly lost: 0 bytes in 0 blocks
==65012==    still reachable: 0 bytes in 0 blocks
==65012==         suppressed: 0 bytes in 0 blocks
Now we see that the allocation occurred on line 5 of leak.c – a precise, actionable diagnostic.
malloc (vg_replace_malloc.c:447)
main (leak.c:5)
However, memory leaks are only one class of memory-related issue. QA engineers must also monitor runtime memory behavior. For example:
- Gradual memory growth over hours (without leaks).
- Sudden spikes during specific workflows.
- Excessive allocation of temporary objects.
These often stem from design-level inefficiencies – such as unnecessary copying, oversized caches, or suboptimal data structures – rather than missing free() calls. While not leaks per se, such patterns can lead to out-of-memory conditions, swapping, or degraded responsiveness in long-lived applications.
To investigate these scenarios, Massif is the appropriate Valgrind tool. It profiles heap usage over time and generates detailed snapshots of memory consumption, enabling engineers to pinpoint where and when memory pressure arises.
What Massif Is and How It Differs From Memcheck
While Memcheck focuses on memory correctness – detecting leaks, buffer overruns, and use of uninitialized values – Massif is a heap profiler that analyzes memory consumption patterns over time.
Massif answers questions such as:
- How much heap memory does the application use at any given point?
- When do memory usage peaks occur, and what triggers them?
- Which functions or modules contribute most to heap growth?
- How does allocation behavior evolve during execution?
- Compared to Memcheck, Massif imposes significantly lower runtime overhead, making it practical for profiling large workloads or long-running scenarios.
Massif monitors all standard heap operations: malloc, calloc, realloc, new, and delete. It also captures:
- Internal allocations from libraries (e.g., Qt, STL).
- Allocator metadata overhead (a proxy for fragmentation).
- Stack usage – when enabled with
--stacks=yes. - Peak resident set size (RSS) and heap usage.
It records memory snapshots at strategic points – primarily around allocation and deallocation events – capturing:
- Current total heap size.
- Call stacks responsible for each allocation.
- Breakdown of live object sizes.
- Allocator bookkeeping overhead.
By examining these snapshots, QA engineers can uncover systemic issues such as:
- Unbounded caches that grow indefinitely.
- Log buffers or event queues that accumulate data without cleanup.
- Excessive data copying (e.g., repeated vector reallocations or deep copies).
- Long-lived temporary objects retained in containers.
- Memory buildup in third-party libraries (e.g., Qt, OpenSSL), even when no explicit leak exists.
A Minimal Massif Example: Observing Linear Heap Growth. Consider a program that repeatedly allocates objects but never frees them:
#include <stdlib.h>
#include <unistd.h>  // for usleep()

typedef struct {
    int id;
    char padding[1024];  // ~1 KB per object
} Object;

int main(void) {
    int counter = 0;

    while (1) {
        Object *obj = (Object *)malloc(sizeof(Object));
        if (!obj) return 1;

        obj->id = counter;
        // Leak: obj is never freed
        counter++;

        usleep(10000);  // 10 ms delay for readable profiling
    }
    return 0;
}
This loop causes heap usage to grow linearly – an ideal case for Massif analysis. Run it with:
valgrind \
  --tool=massif \
  --massif-out-file=valgrind.%p.massif \
  --time-unit=i \
  --pages-as-heap=yes \
  --xtree-memory=full \
./leak_memory-
Key options explained
--tool=massif
Selects the heap profiler (Massif is not the default tool).
--massif-out-file=valgrind.%p.massif
Names the output file using the process ID (%p) to avoid overwrites during parallel runs.
--time-unit=i
Uses instruction count as the time axis in reports. This ensures deterministic, reproducible profiles – independent of CPU speed or system load.
--pages-as-heap=yes
Includes memory pages allocated viammap(e.g., by glibc's allocator for large requests) in heap totals. Critical for accurate accounting in modern allocators.
--xtree-memory=full
Generates an XTree memory profile – a hierarchical allocation map that shows which call paths allocate how much memory. The option generates allocation trees, but their usefulness depends entirely on symbol availability! Always compile the target binary and its dependencies with-g(and ideally-O0or-Ogto preserve debug fidelity).
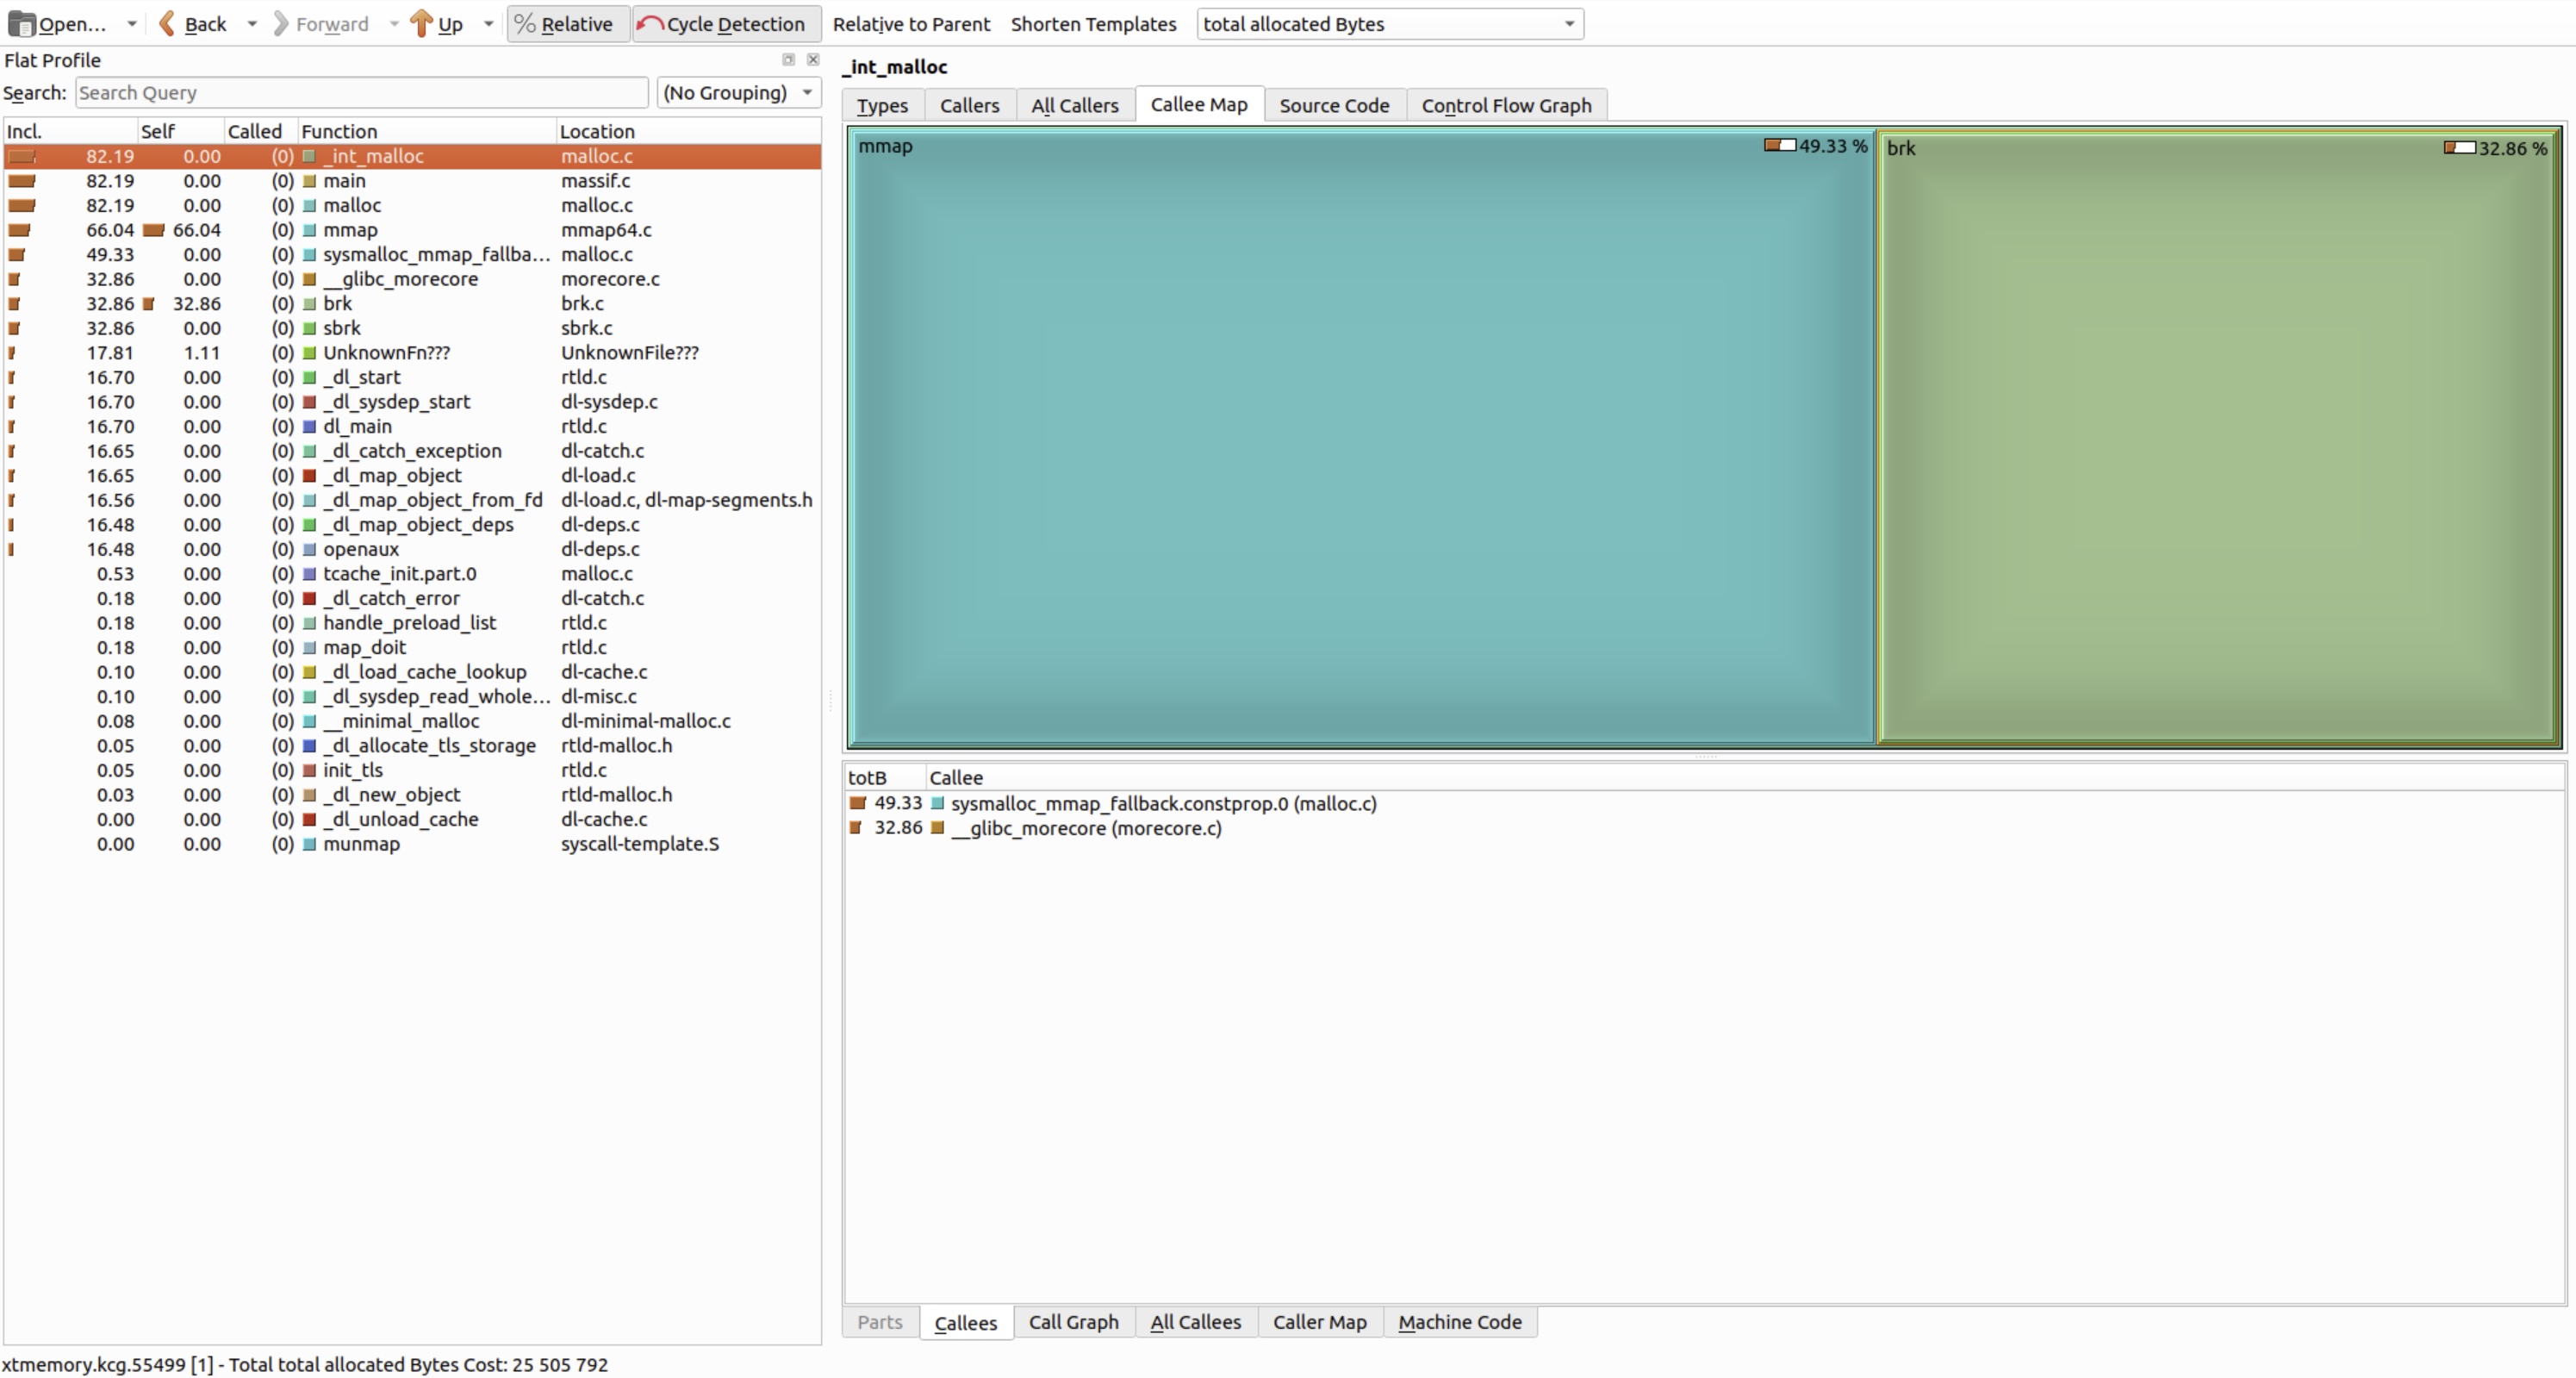
The .xtmemory file can be visualized in KCachegrind or QCachegrind:
The viewer reveals hotspots: functions responsible for sustained heap growth, allocation chains, and object lifetime patterns – invaluable for performance QA.sudo snap install kcachegrind
For command-line workflows, Valgrind provides ms_print – a dedicated utility that parses massif.out files and produces a human-readable summary, including a text-based memory-usage graph.
ms_print delivers:
- A time-series ASCII graph of heap consumption.
- A list of recorded snapshots, with the global peak highlighted.
- Breakdown of peak memory: total, useful heap, allocator overhead, and (optionally) stack usage.
- Allocation call trees for the largest memory consumers.
- Quick identification of problematic code paths.
Run it as follows:
ms_print ./valgrind.XXXXX.massifSample output (abbreviated for clarity):
--------------------------------------------------------------------------------
Command:            ./leak_memory
Massif arguments:   --massif-out-file=valgrind.%p.massif --time-unit=i --pages-as-heap=yes --xtree-memory=full
ms_print arguments: ./valgrind.XXXXX.massif
--------------------------------------------------------------------------------


    MB
24.30^                                                                       :
     |                                                                    ::::
     |                                                                :::::  :
     |                                                            :::::   :  :
     |                                                         ::::   :   :  :
     |                                                 ::::@@@@:  :   :   :  :
     |                                              ::::   @   :  :   :   :  :
     |                                          :::::  :   @   :  :   :   :  :
     |                                      :::::   :  :   @   :  :   :   :  :
     |                                   ::::   :   :  :   @   :  :   :   :  :
     |                              ::::::  :   :   :  :   @   :  :   :   :  :
     |                          :::@::   :  :   :   :  :   @   :  :   :   :  :
     |                     :::@::::@::   :  :   :   :  :   @   :  :   :   :  :
     |                 ::@::::@::::@::   :  :   :   :  :   @   :  :   :   :  :
     |             ::@:::@::::@::::@::   :  :   :   :  :   @   :  :   :   :  :
     |        ::@::::@:::@::::@::::@::   :  :   :   :  :   @   :  :   :   :  :
     |    ::::::@::::@:::@::::@::::@::   :  :   :   :  :   @   :  :   :   :  :
     |:#::::::::@::::@:::@::::@::::@::   :  :   :   :  :   @   :  :   :   :  :
     |:#::::::::@::::@:::@::::@::::@::   :  :   :   :  :   @   :  :   :   :  :
     |:#::::::::@::::@:::@::::@::::@::   :  :   :   :  :   @   :  :   :   :  :
   0 +----------------------------------------------------------------------->Mi
     0                                                                   5.166

Number of snapshots: 54
 Detailed snapshots: [2 (peak), 12, 17, 22, 28, 38, 48]

--------------------------------------------------------------------------------
  n        time(i)         total(B)   useful-heap(B) extra-heap(B)    stacks(B)
--------------------------------------------------------------------------------
  0              0            4,096            4,096             0            0
  1         52,339        4,538,368        4,538,368             0            0
  2        135,961        4,538,368        4,538,368             0            0
100.00% (4,538,368B) (page allocation syscalls) mmap/mremap/brk, --alloc-fns, etc.
->93.86% (4,259,840B) 0x402AD2C: __mmap64 (mmap64.c:58)
| ->93.86% (4,259,840B) 0x402AD2C: mmap (mmap64.c:46)
|   ->48.29% (2,191,360B) 0x400CE17: _dl_map_segment (dl-map-segments.h:29)
|   | ->48.29% (2,191,360B) 0x400CE17: _dl_map_segments (dl-map-segments.h:101)
|   |   ->48.29% (2,191,360B) 0x400CE17: _dl_map_object_from_fd (dl-load.c:1258)
|   |     ->48.29% (2,191,360B) 0x400E528: _dl_map_object (dl-load.c:2268)
|   |       ->47.83% (2,170,880B) 0x4007A2C: openaux (dl-deps.c:64)
|   |       | ->47.83% (2,170,880B) 0x400651B: _dl_catch_exception (dl-catch.c:237)
|   |       |   ->47.83% (2,170,880B) 0x4007E66: _dl_map_object_deps (dl-deps.c:232)
|   |       |     ->47.83% (2,170,880B) 0x402741B: dl_main (rtld.c:1965)
|   |       |       ->47.83% (2,170,880B) 0x4023F45: _dl_sysdep_start (dl-sysdep.c:140)
|   |       |         ->47.83% (2,170,880B) 0x402575D: _dl_start_final (rtld.c:494)
|   |       |           ->47.83% (2,170,880B) 0x402575D: _dl_start (rtld.c:581)
|   |       |             ->47.83% (2,170,880B) 0x4024547: ??? (in /usr/lib/x86_64-linux-gnu/ld-linux-x86-64.so.2)
|   |       |
|   |       ->00.45% (20,480B) in 1+ places, all below ms_print's threshold (01.00%)
|   |
...
...
This ASCII graph clearly shows continuous heap growth – a strong indicator of unbounded allocation (e.g., missing deallocations or growing caches). Even without symbols, the shape of the curve is diagnostic; with -g, call stacks become actionable.
ms_print is convenient in the terminal, but for deeper analysis, graphical tools offer superior interactivity:
massif-visualizer
An interactive Qt-based viewer for Massif snapshots and allocation trees. Currently Linux-only and requires a GUI environment.sudo apt install massif-visualizer -y- Flame graphs (
massif2flamegraph)
Converts Massif data into memory flame graphs, where bar width reflects allocation size. Ideal for spotting dominant allocation paths. - KCachegrind / QCachegrind
Best for exploring XTree reports (enabled via--xtree-memory=full). Shows hierarchical allocation trees – but requires debug symbols for meaningful function names.
You can explore Massif output either via the command line (ms_print) or graphically using massif-visualizer:
massif-visualizer ./valgrind.XXXXX.massifThe tool displays an interactive timeline of heap usage – revealing trends such as steady growth, periodic spikes, or stabilization.
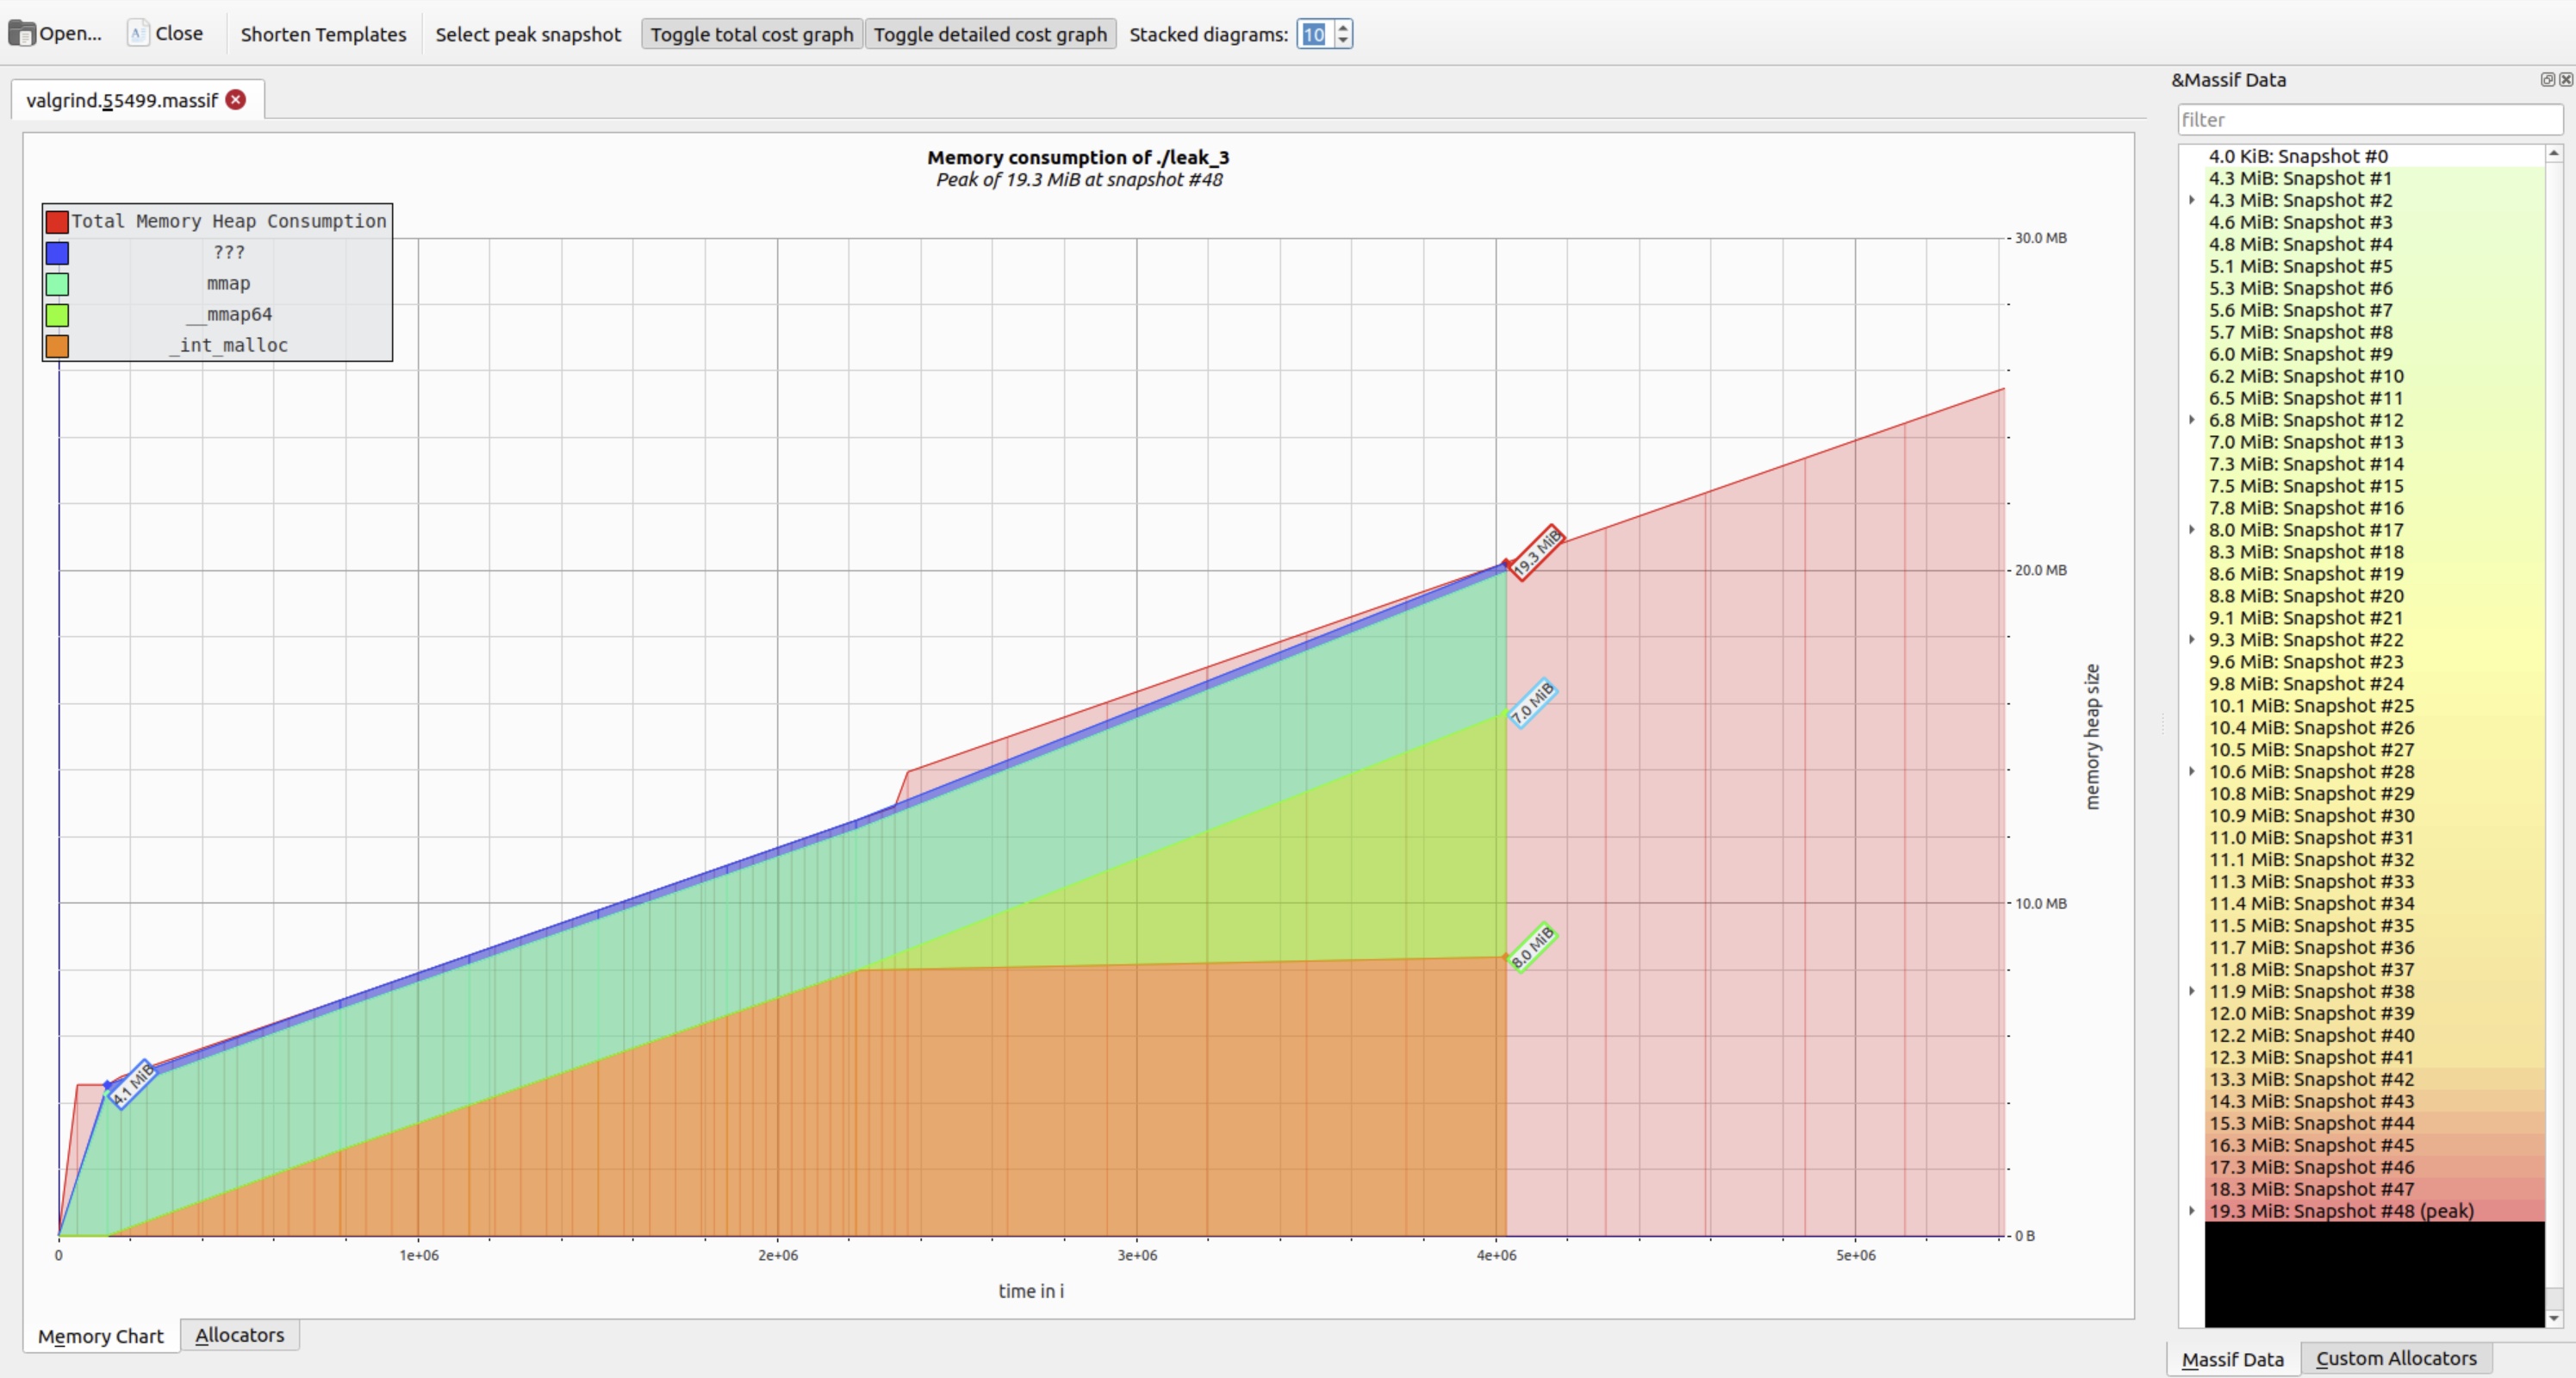
When --xtree-memory=full was used during profiling, the XTree shows a hierarchical allocation map.
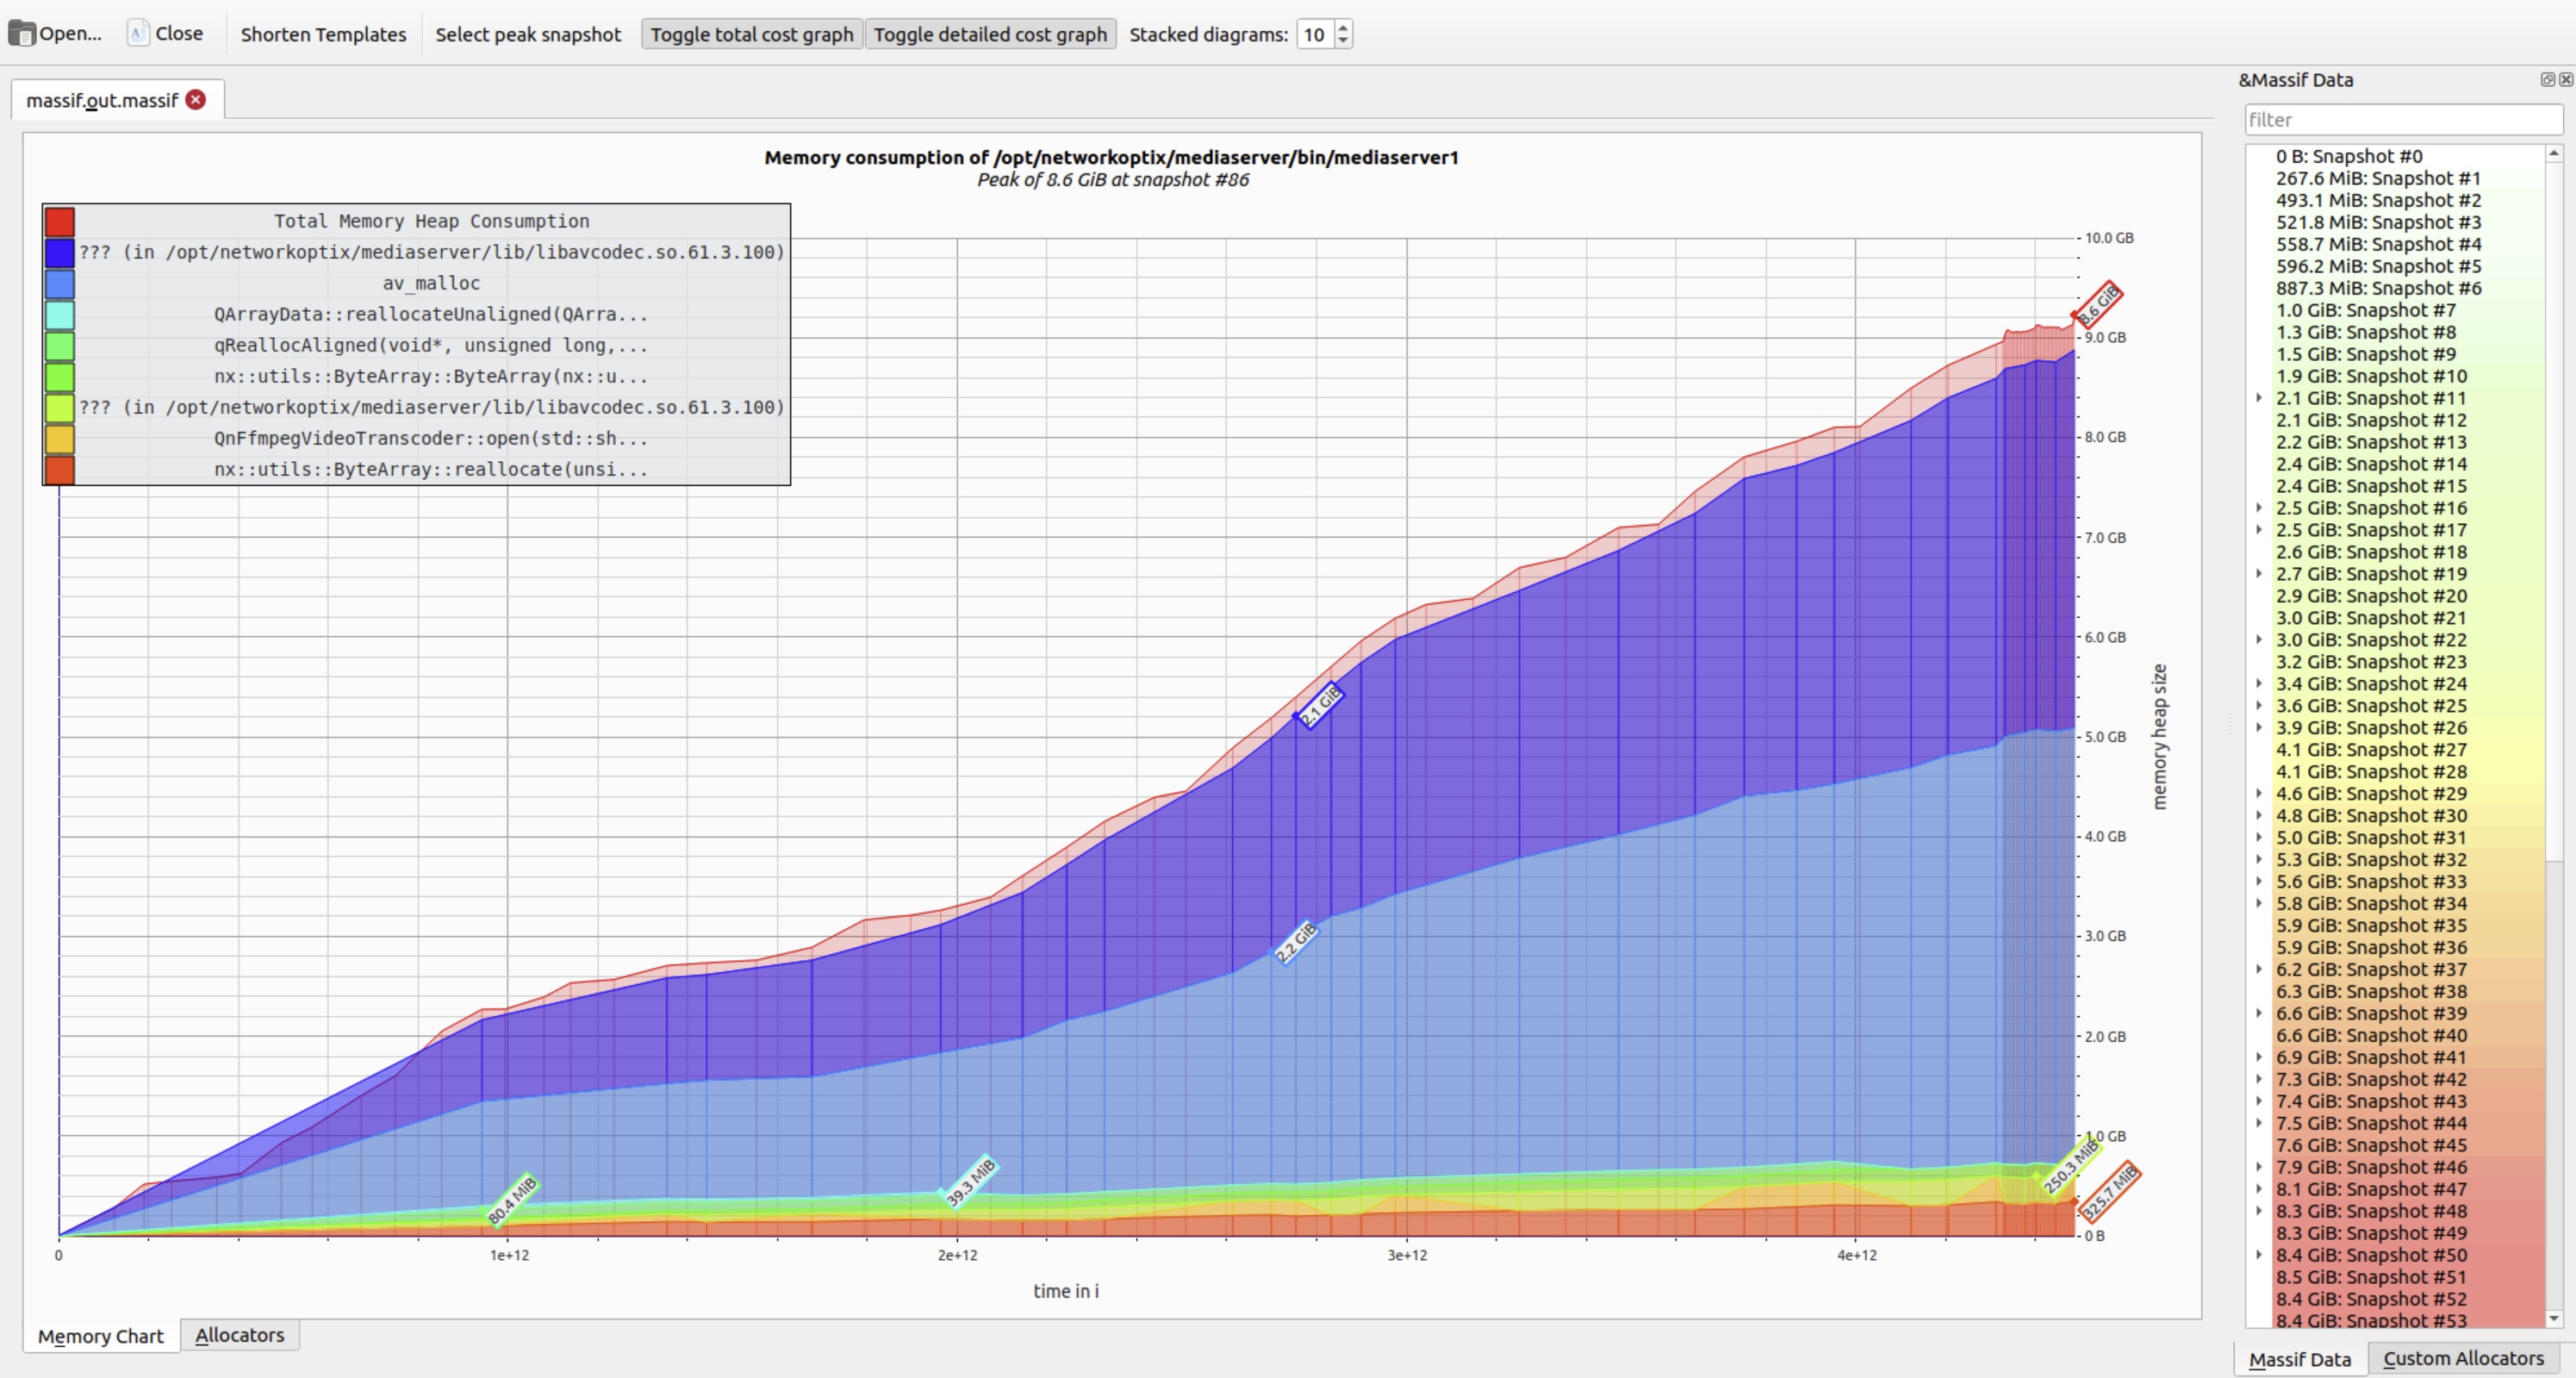
While synthetic examples (like the infinite allocator above) help illustrate concepts, real-world cases are far more instructive. Consider this scenario: a network module in a production service allocated resources for each new client connection but failed to release them upon disconnection. Memory usage grew linearly with traffic – and only plateaued when network activity ceased.
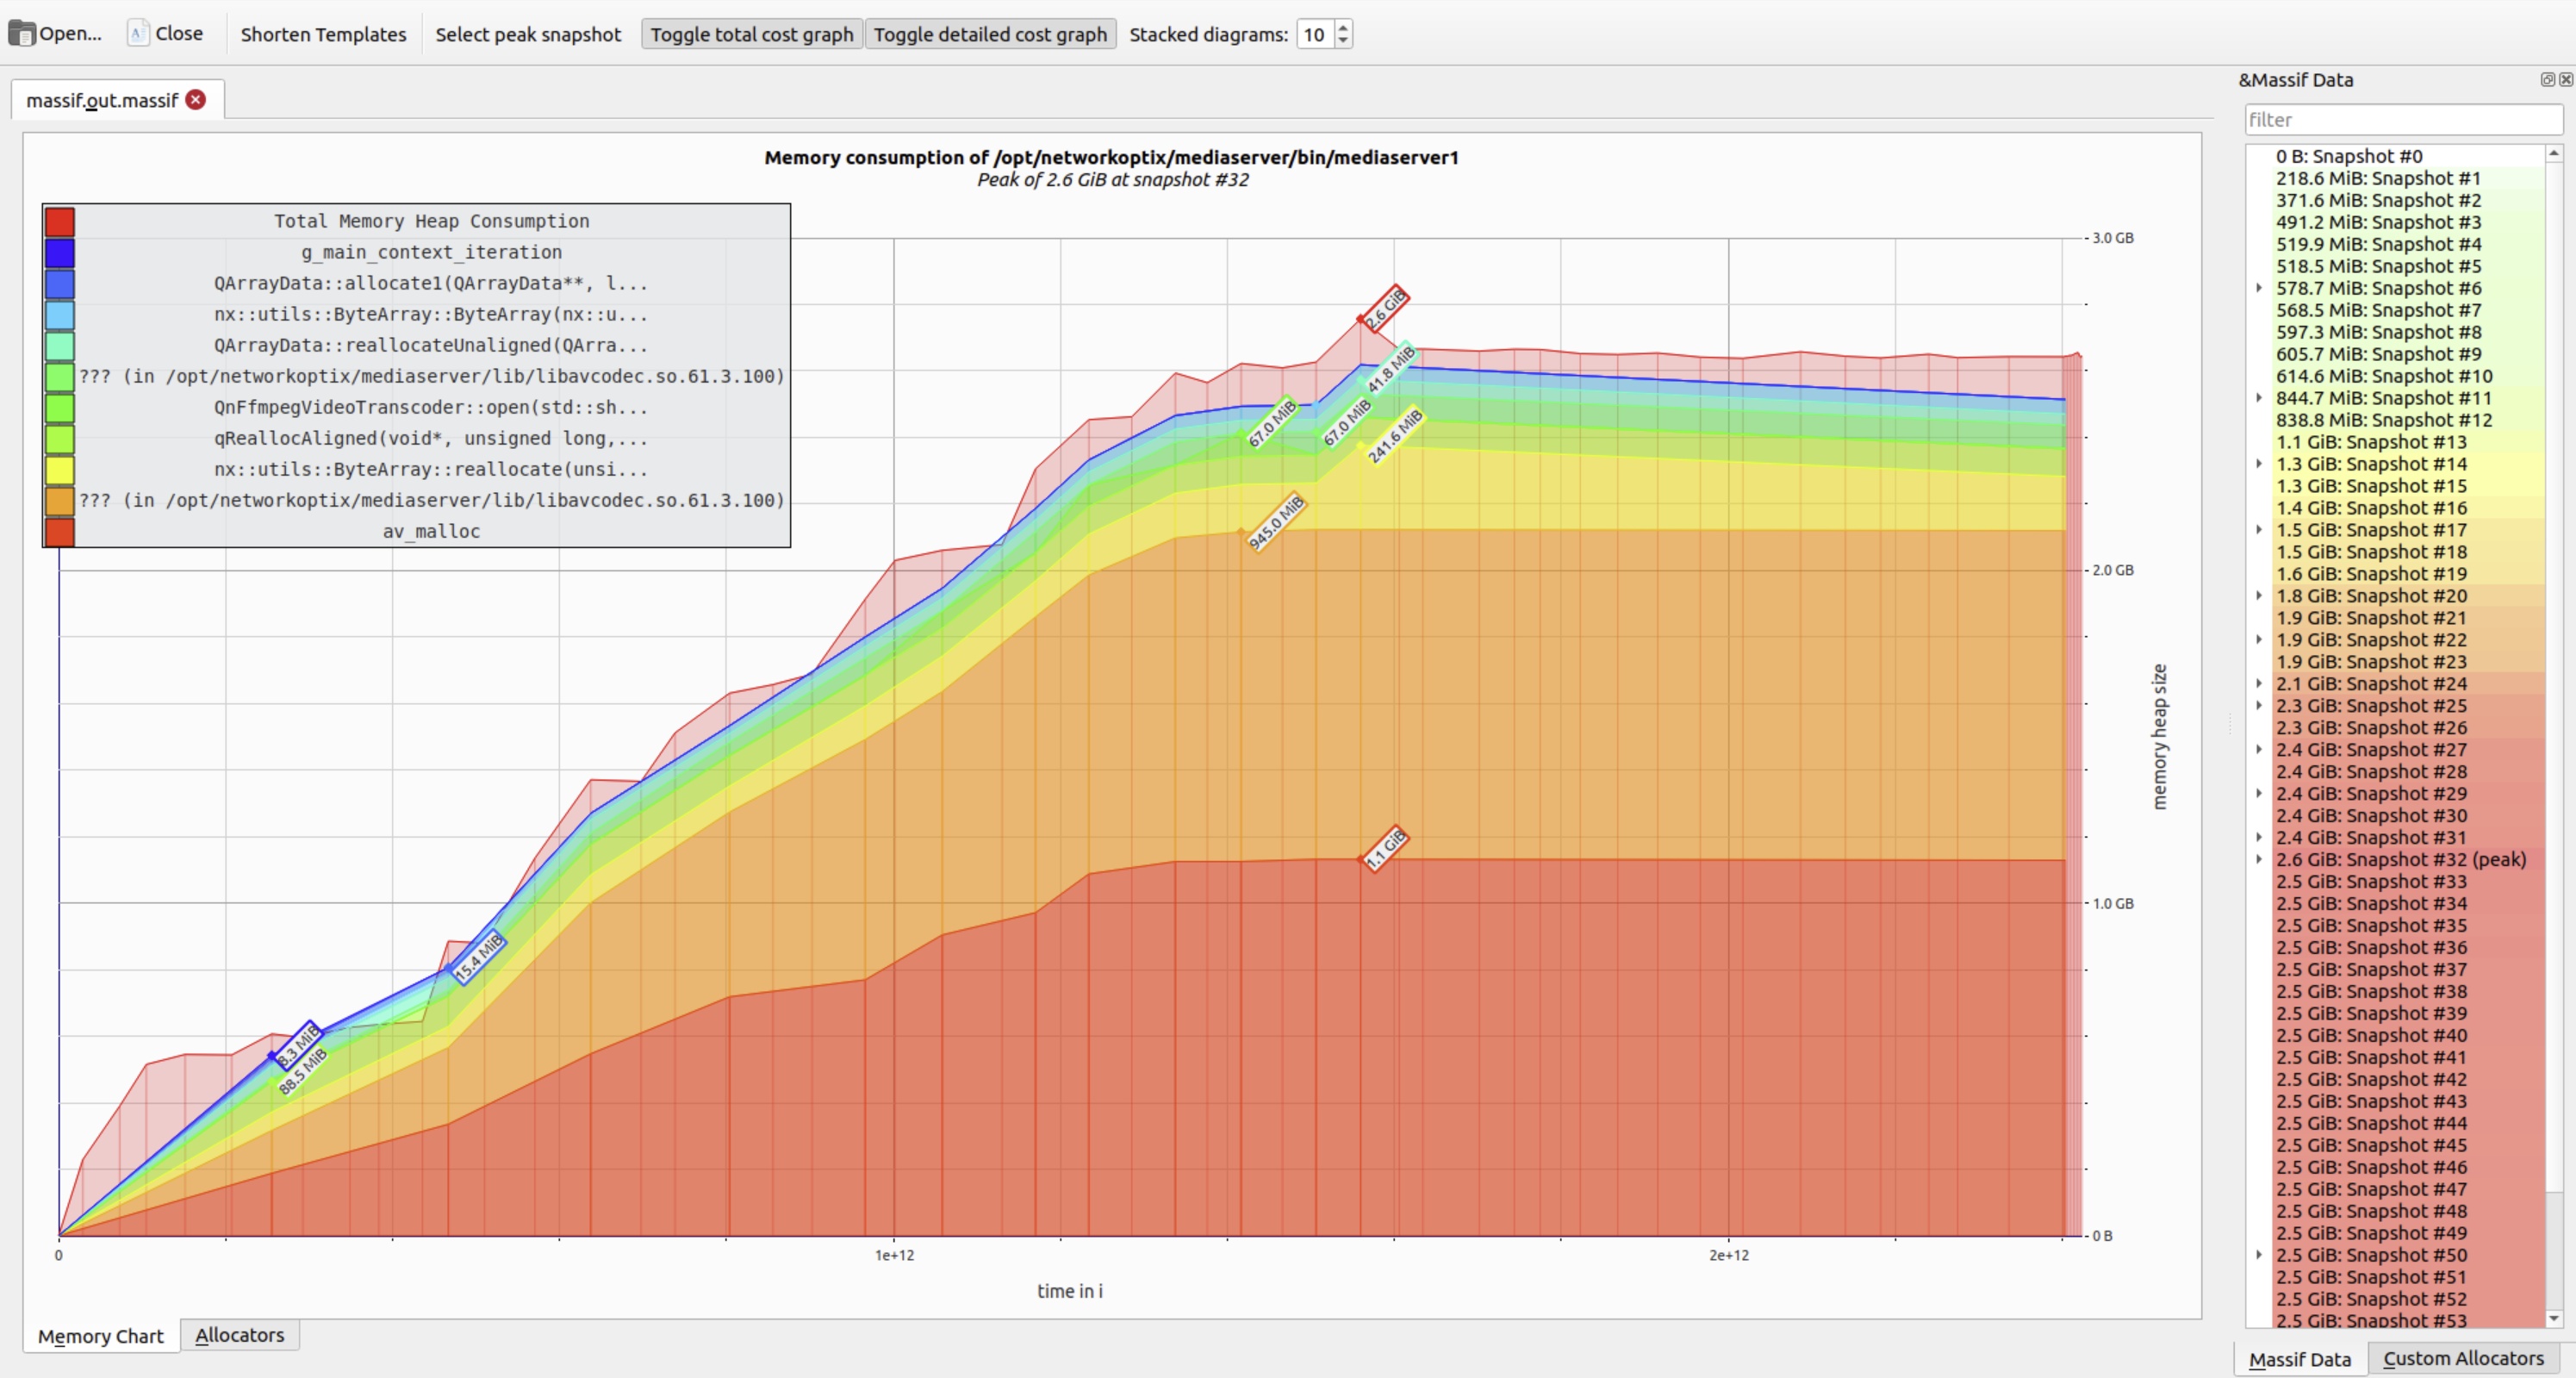
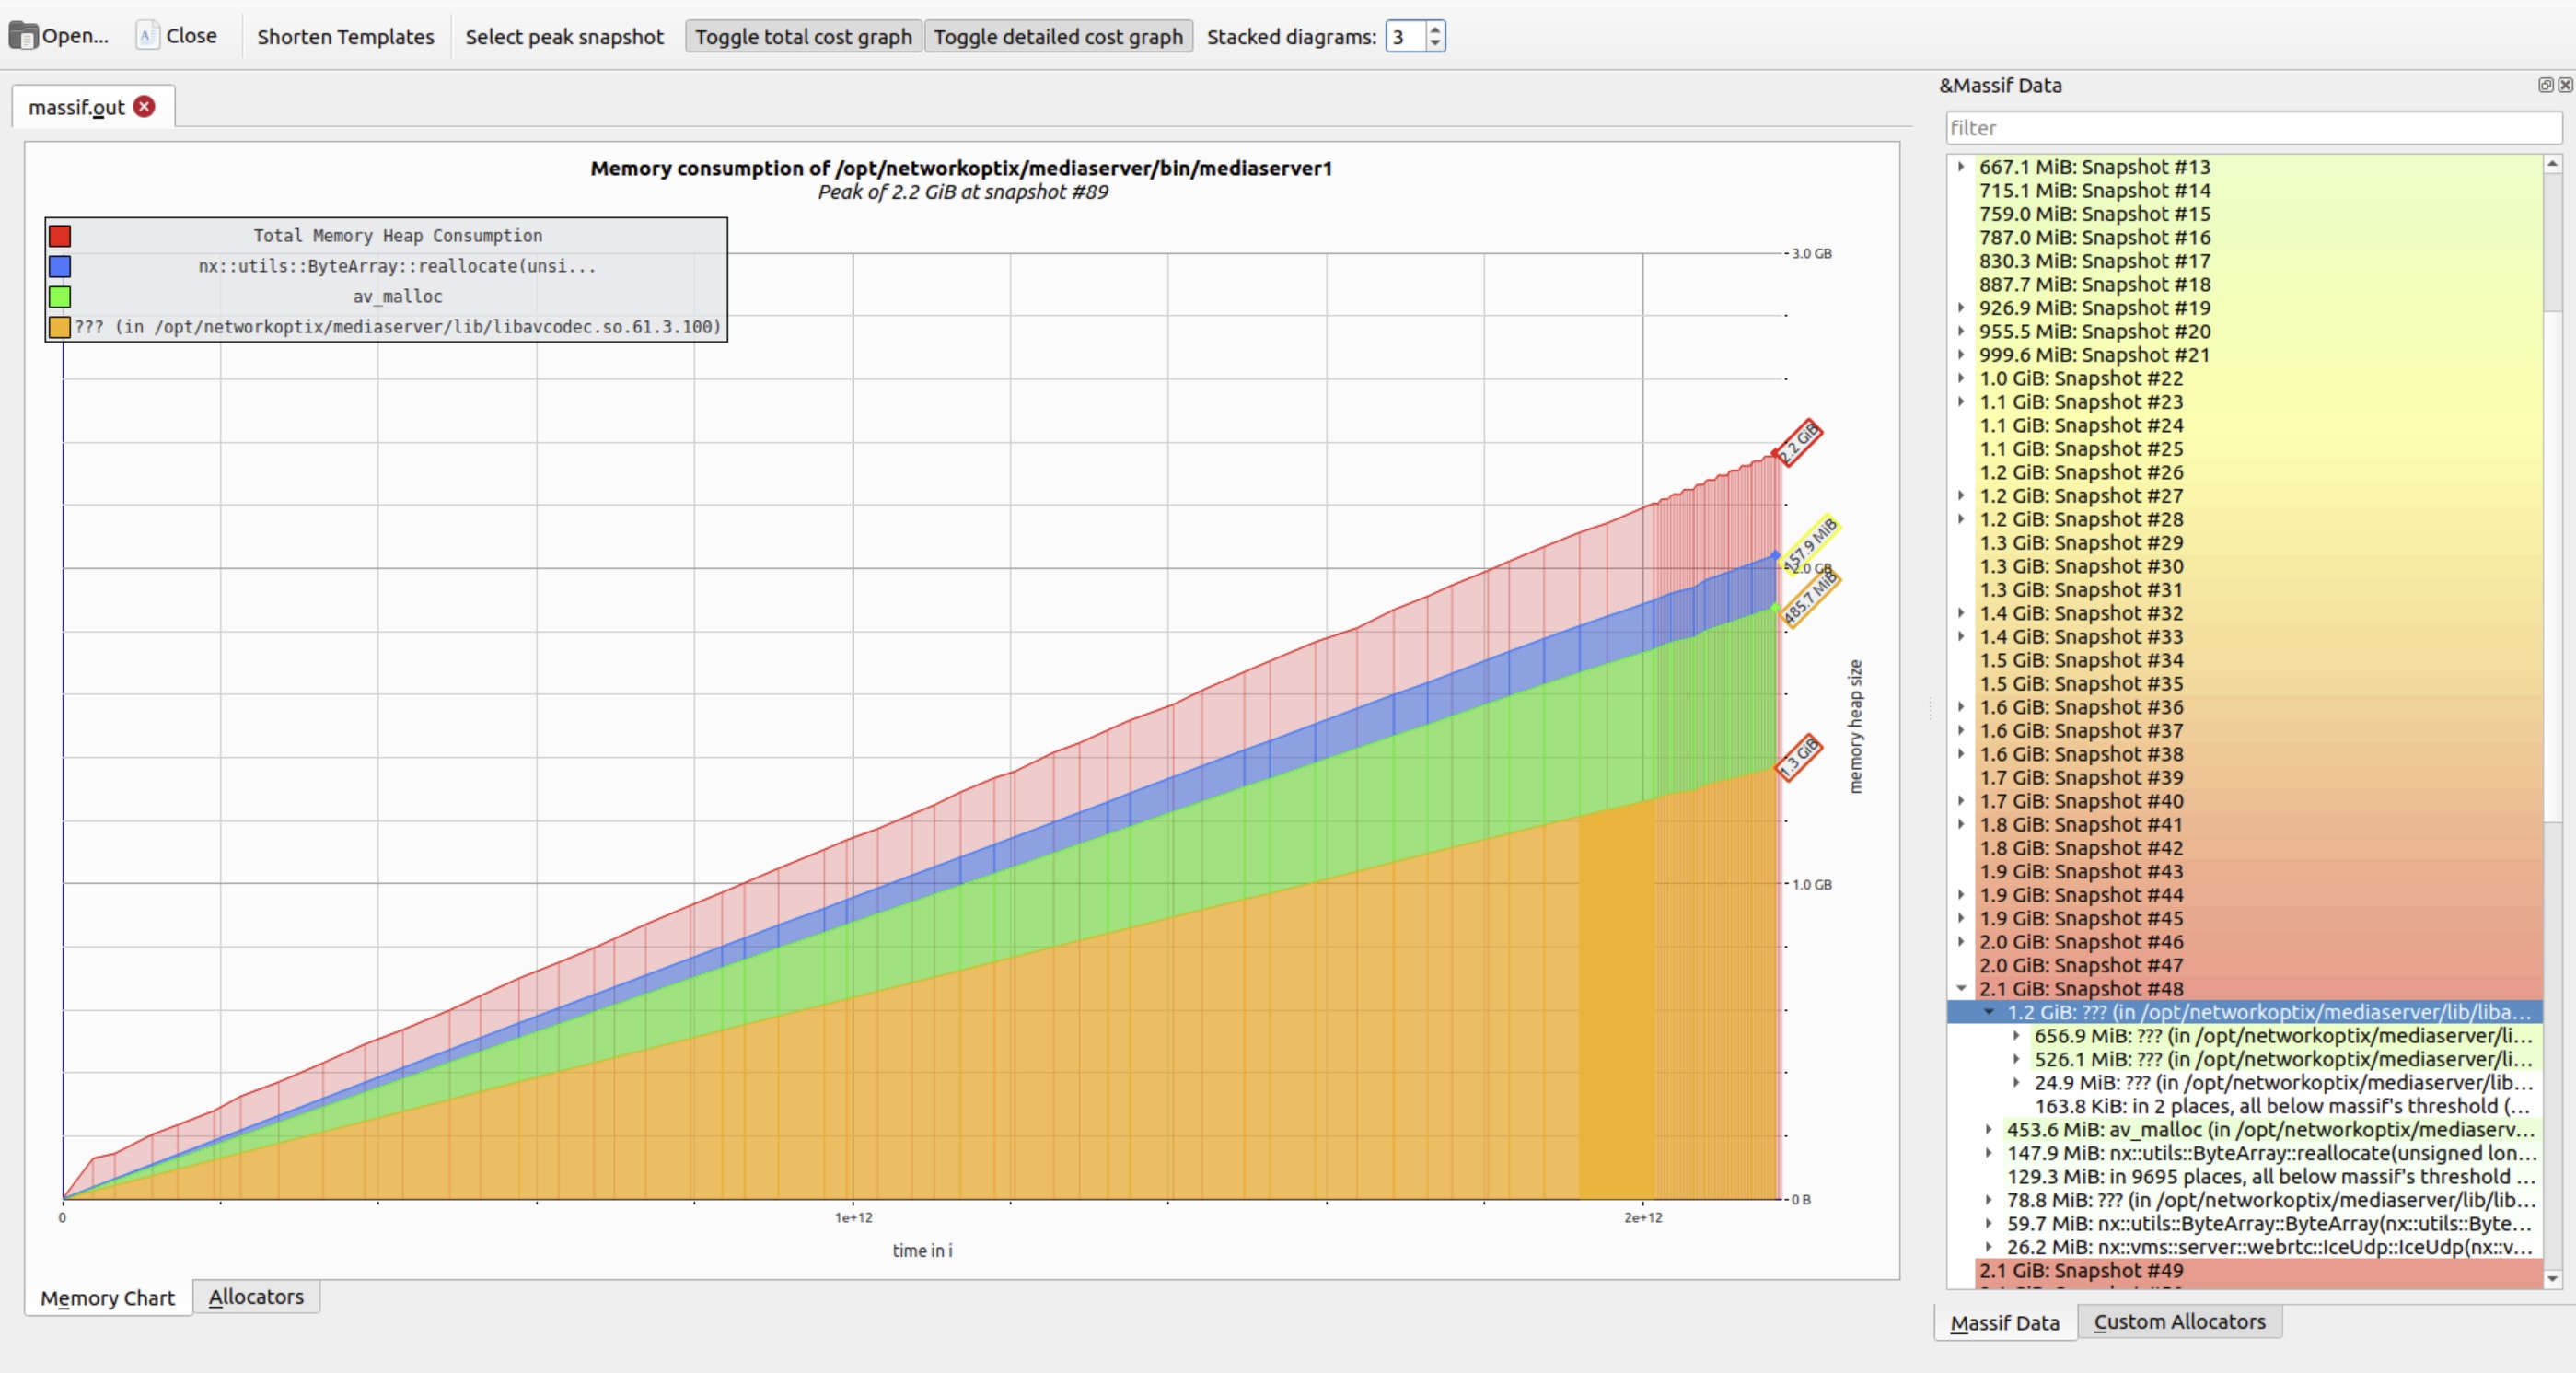
To improve readability, Massif visualizer offers a Stacked diagrams control. Lowering this value collapses minor allocation layers, reducing visual noise and highlighting dominant memory consumers.
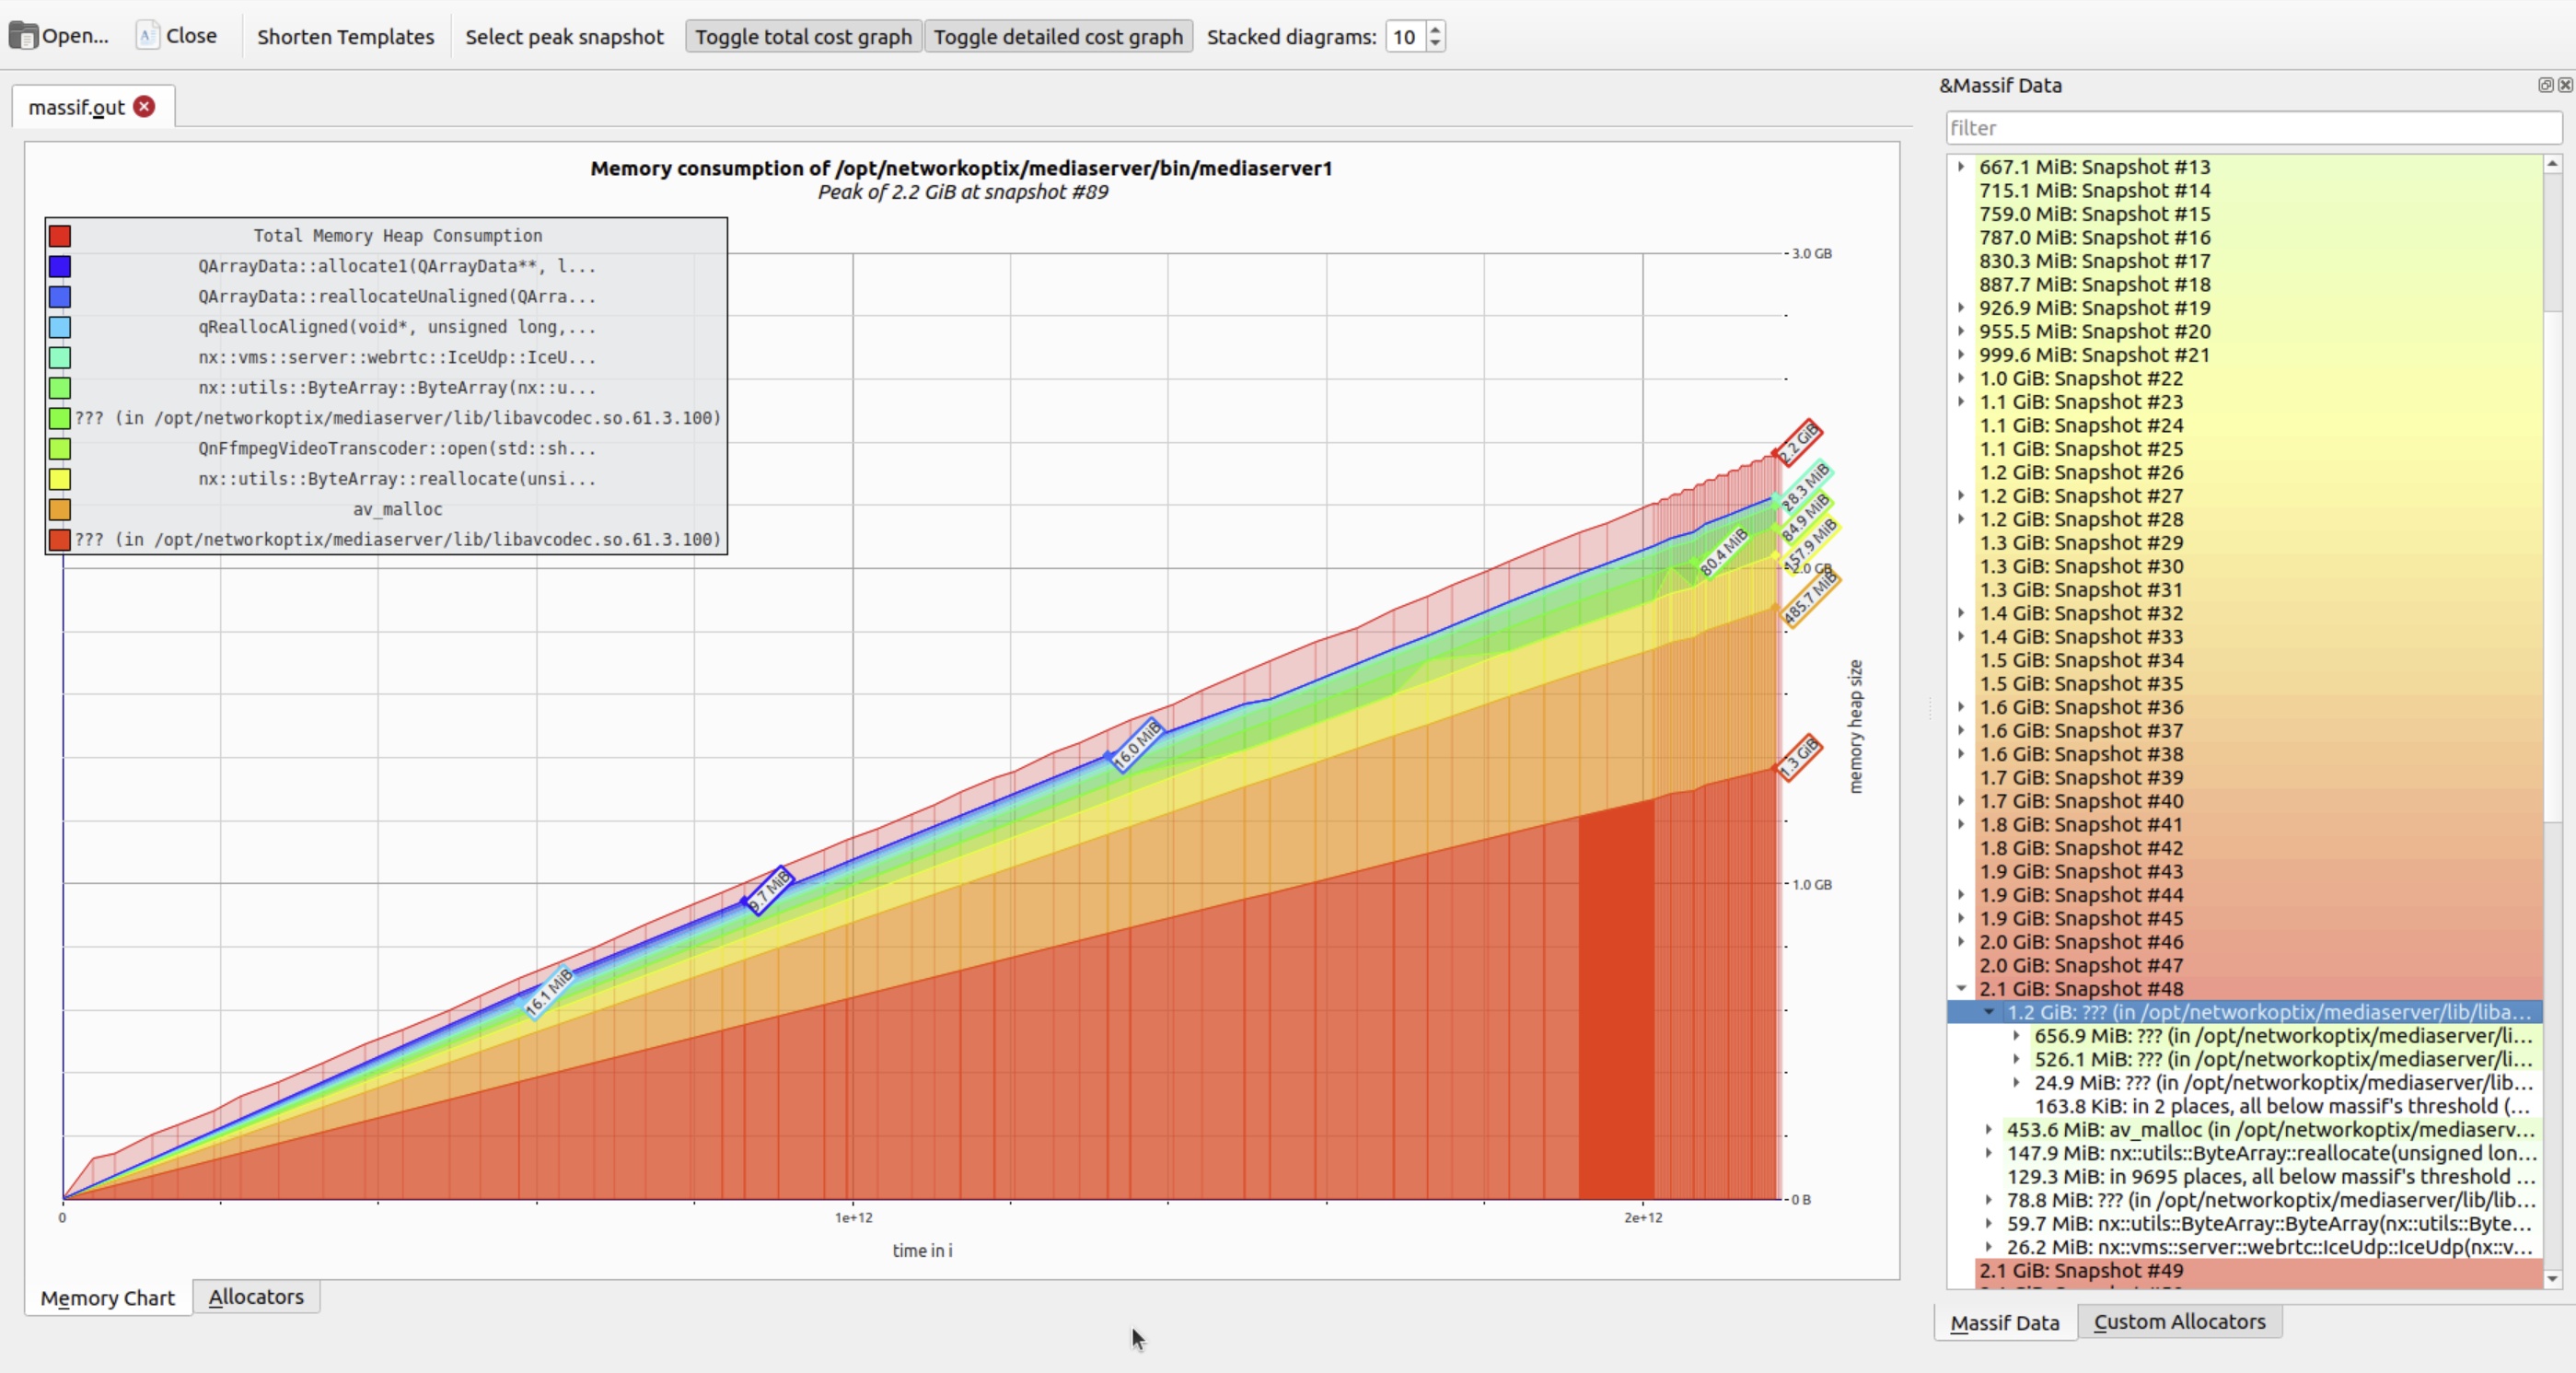
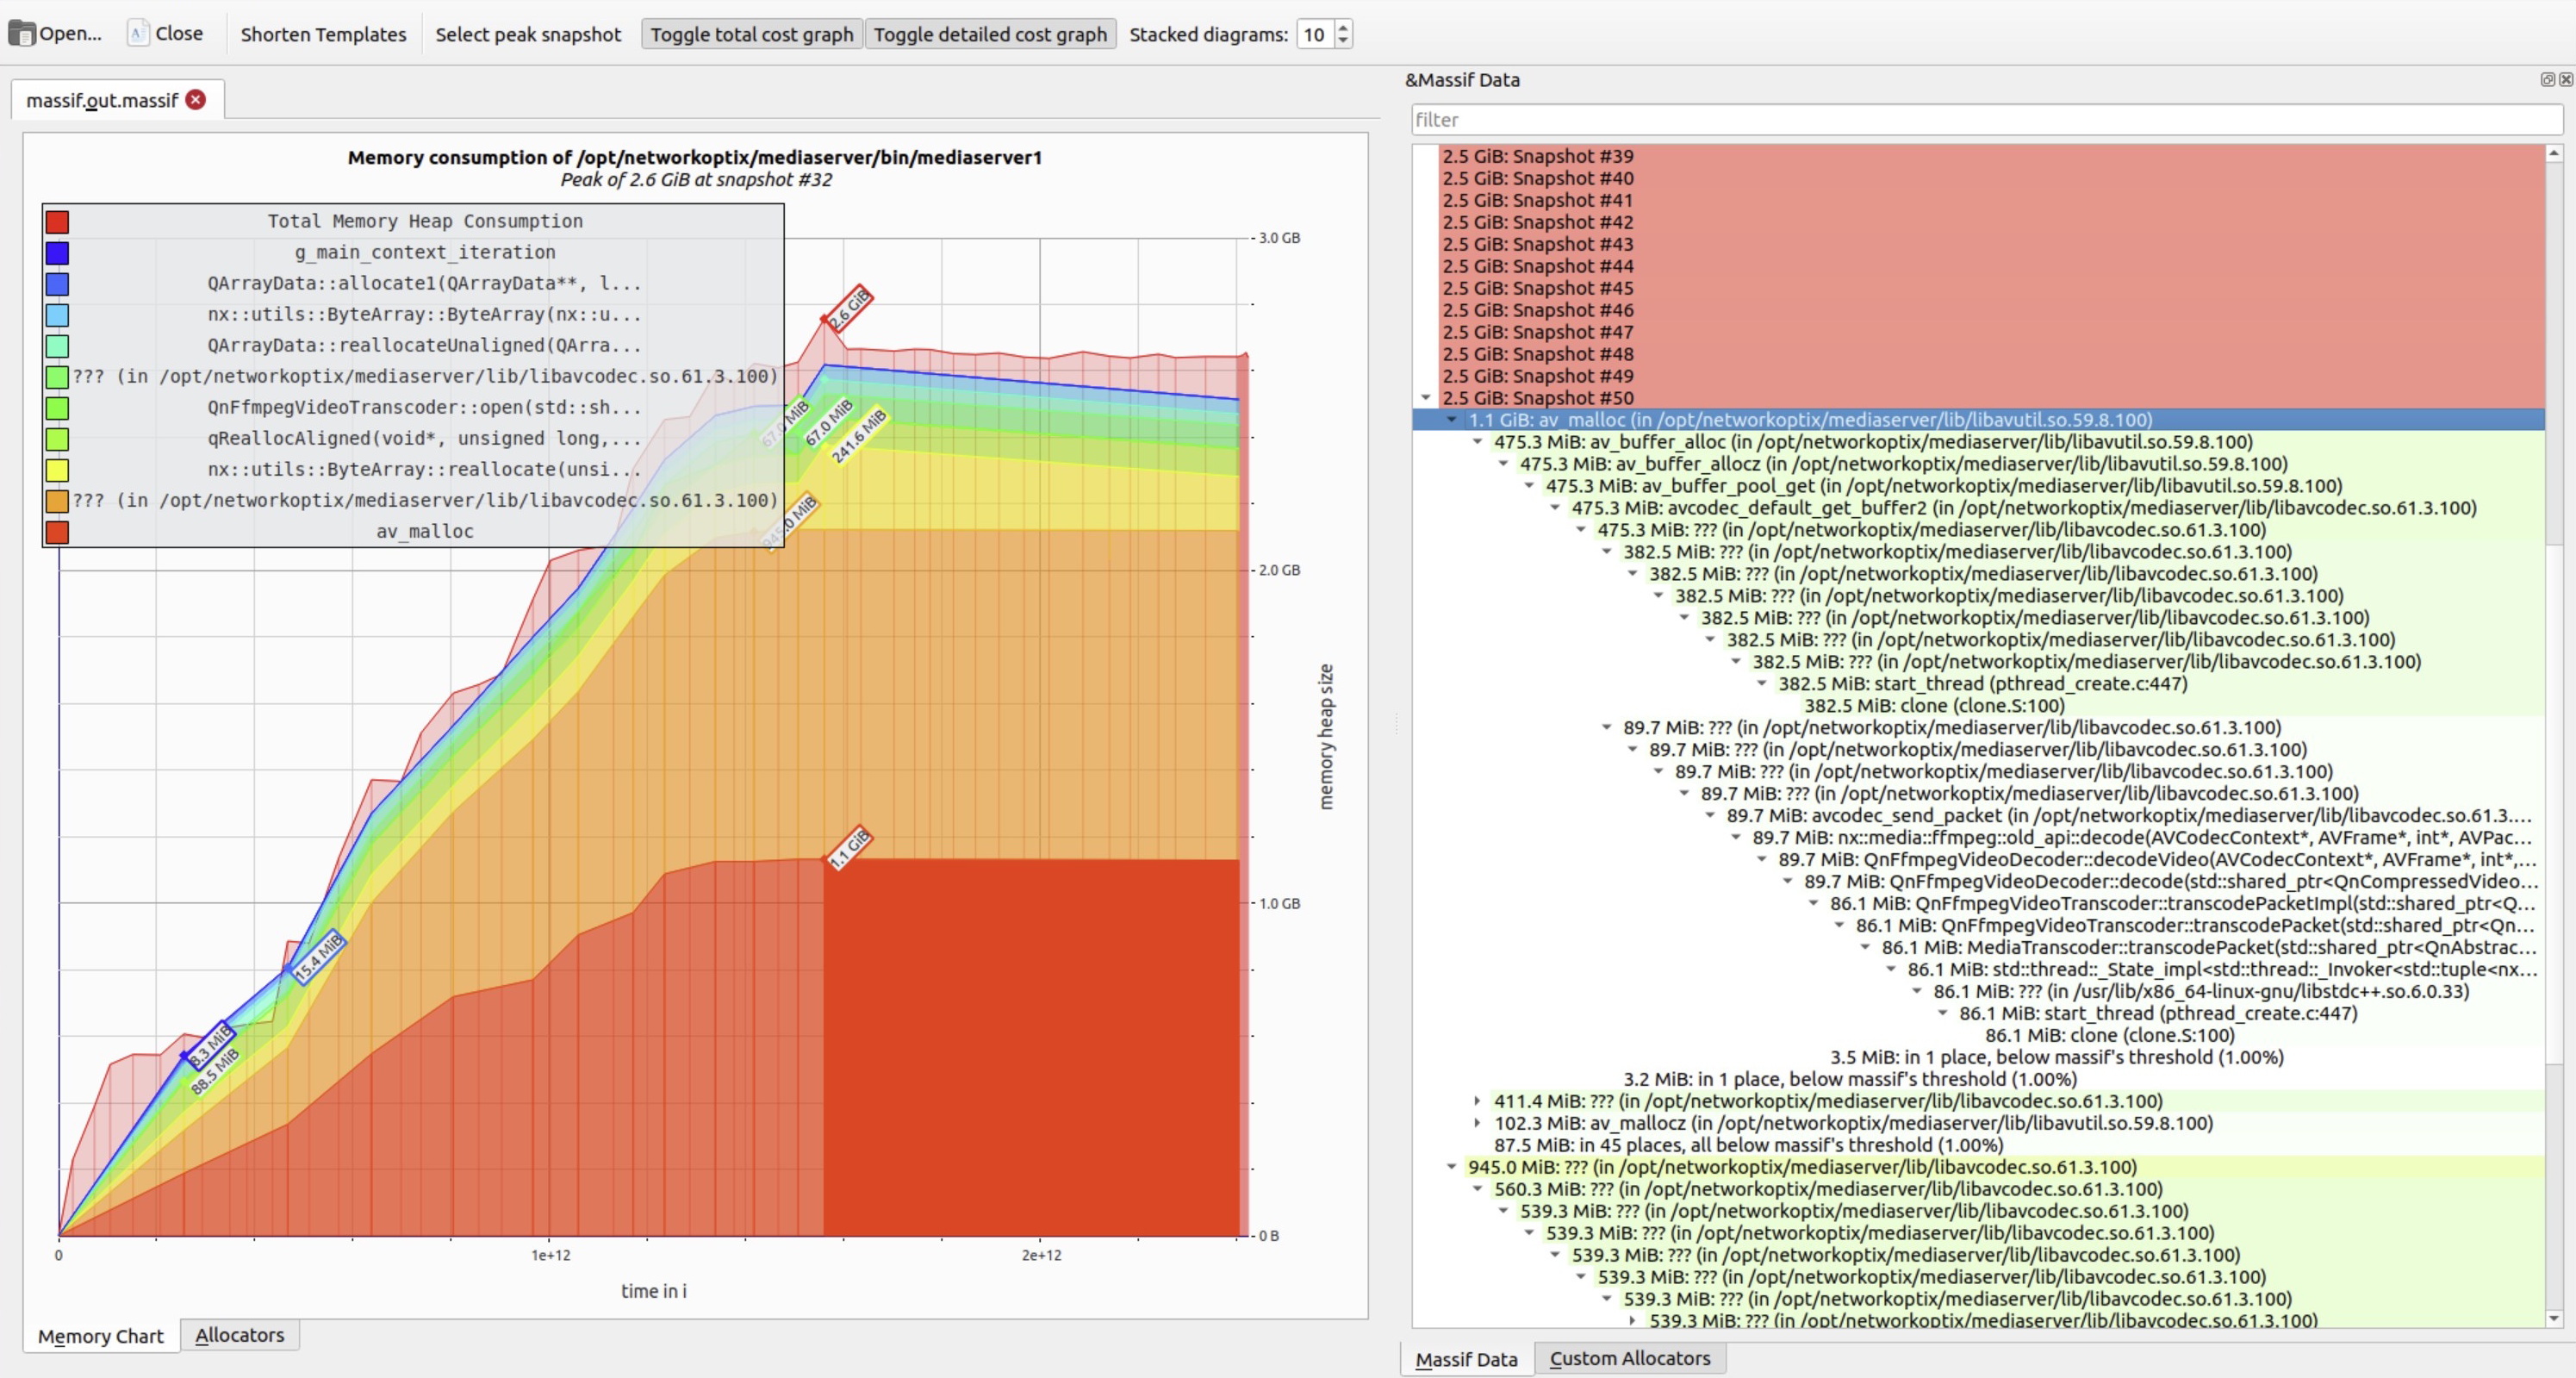
Hovering over any snapshot reveals a detailed breakdown of live allocations at that moment. The right panel shows the corresponding call stack – essential for tracing memory back to its origin.
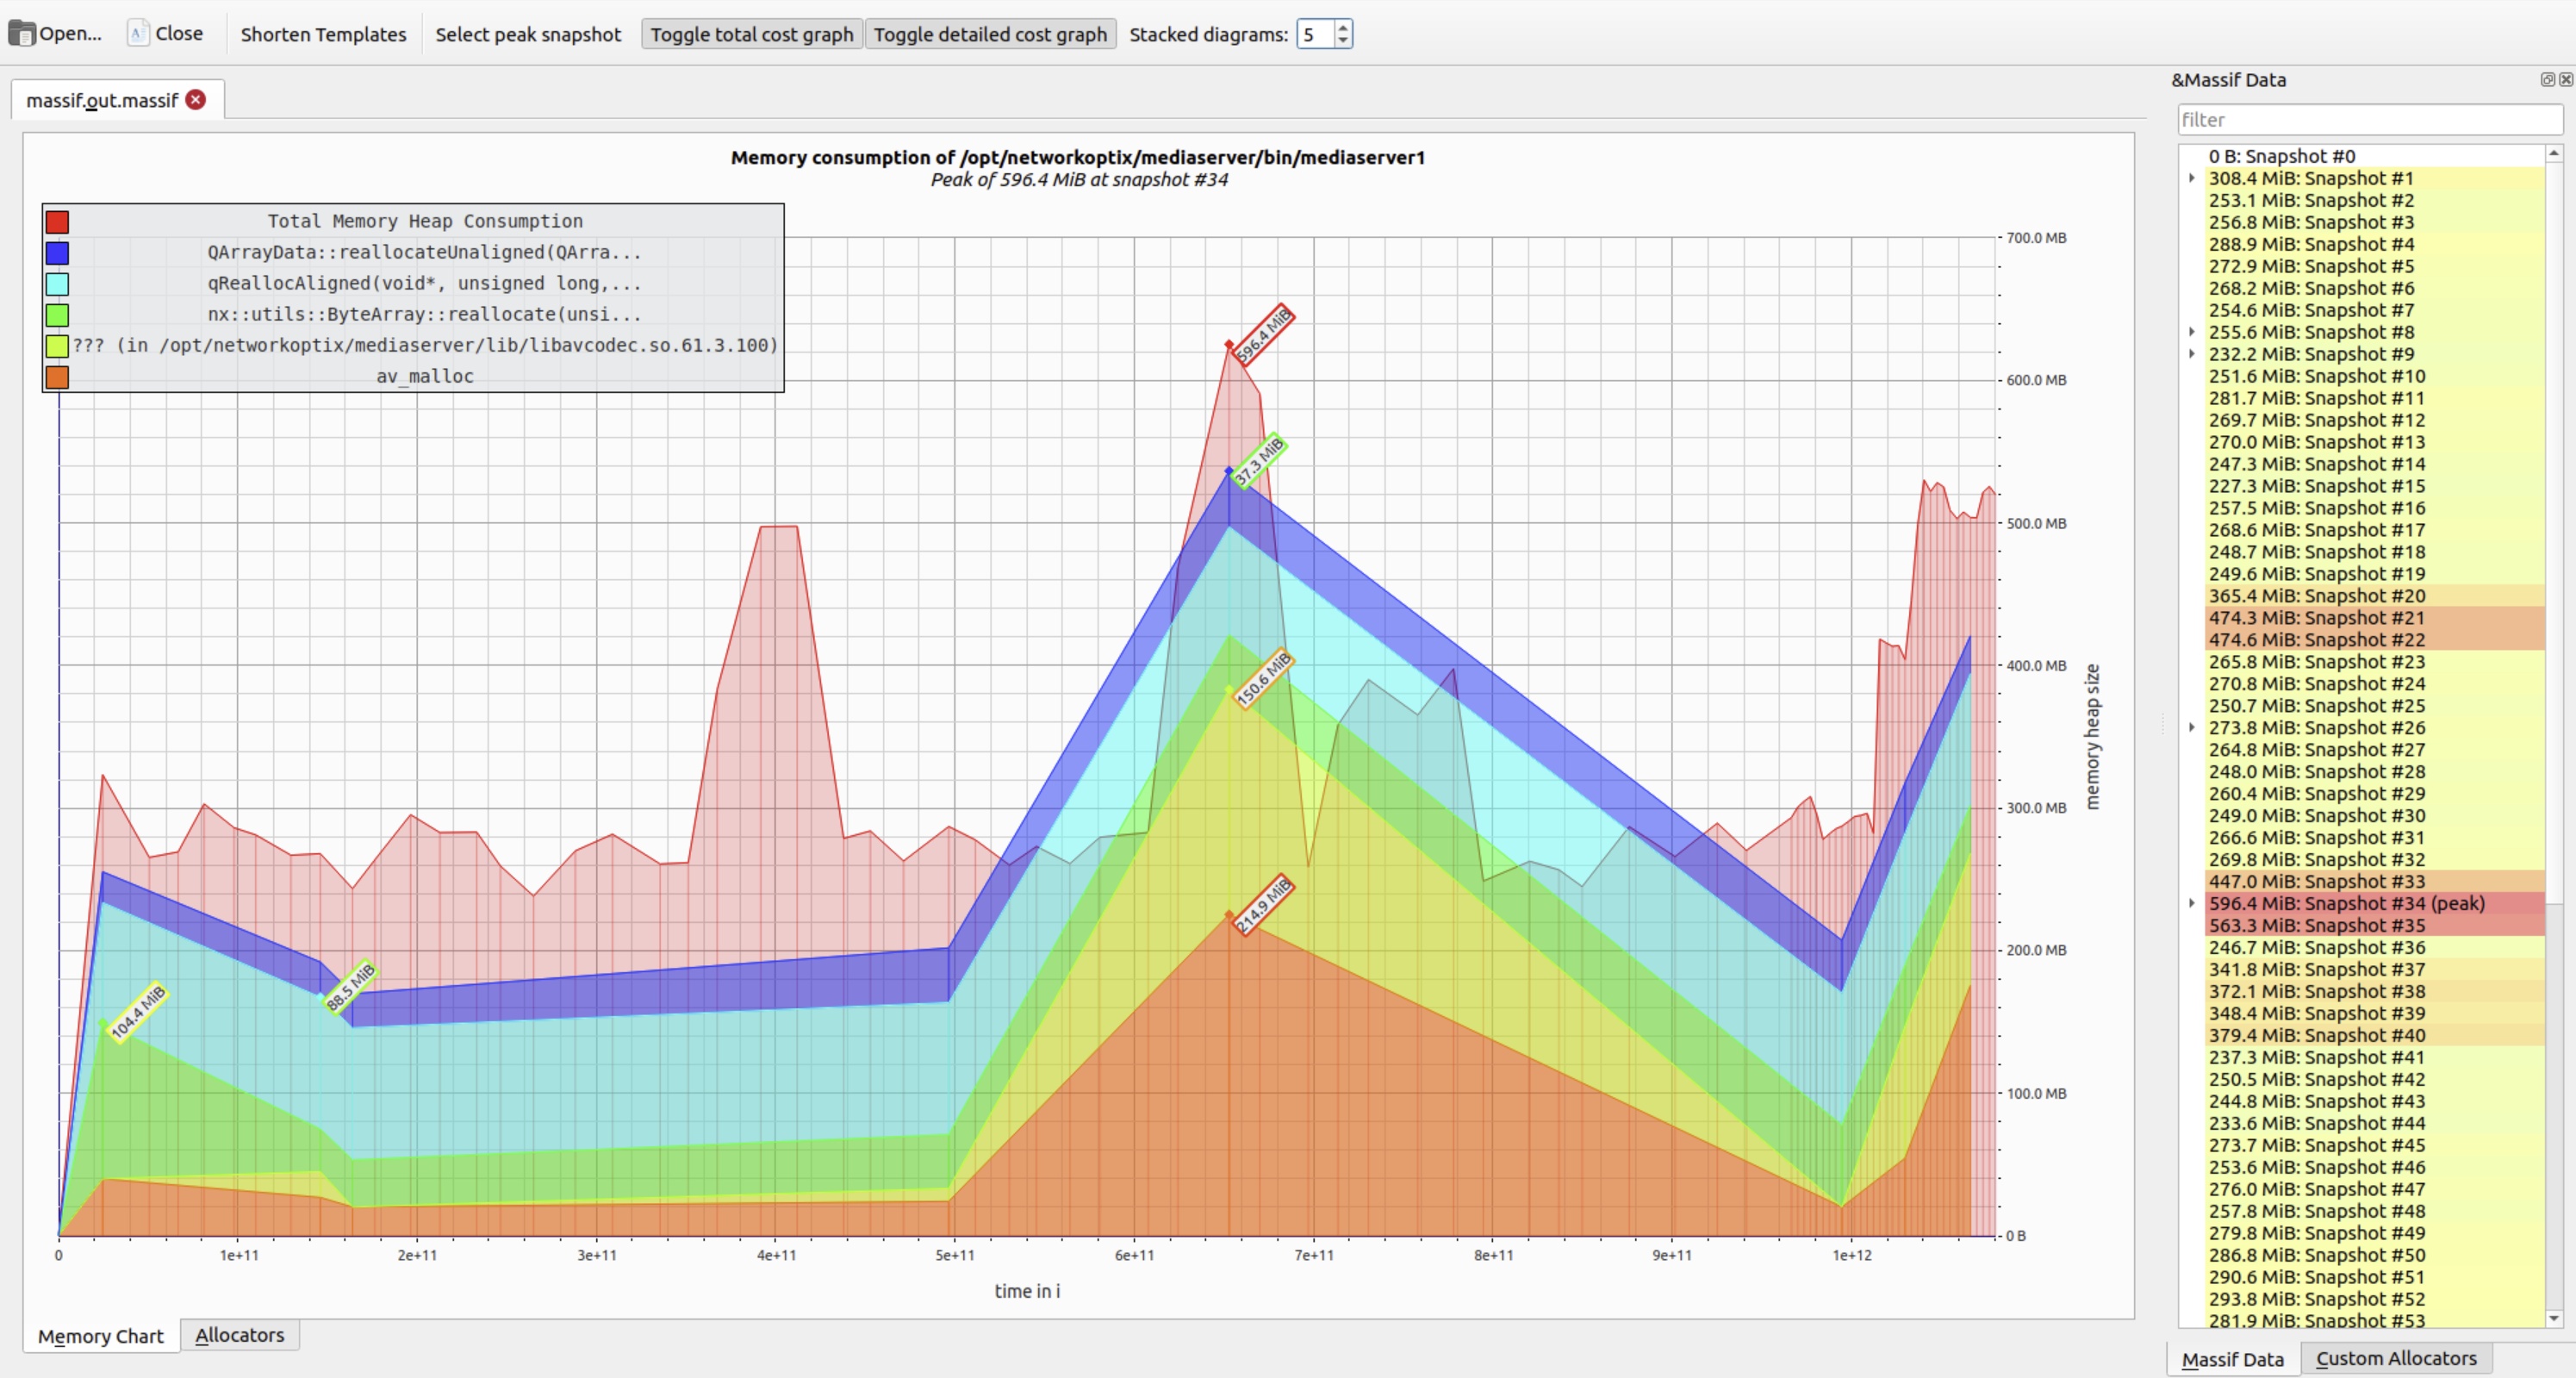
As expected, higher peaks correlate directly with increased heap pressure – often indicating unbounded accumulation.
After locating and correcting the faulty cleanup logic, a follow-up test confirmed the fix: memory usage stabilized at baseline levels, with no sustained growth.
What About Multithreaded Applications?
Valgrind preserves the application's original threading model: the same threads are created, and the high-level concurrency logic remains unchanged. However, because Valgrind interprets every machine instruction (via CPU emulation), it introduces significant slowdown – often 10-50x – which profoundly affects thread scheduling behavior.
This slowdown has two important consequences for QA:
- Reduced thread interleaving: The OS scheduler switches threads less frequently, making execution appear more sequential. This can mask timing-dependent bugs that only arise under high concurrency.
- Suppressed race conditions: Many data races and synchronization issues – especially those triggered by tight contention or specific timing windows – may not manifest during Valgrind runs, leading to false negatives.
To address threading-specific defects, Valgrind provides Helgrind (--tool=helgrind), a dynamic analyzer that detects:
- Data races (unsynchronized concurrent accesses).
- Misuse of POSIX threading primitives (e.g., unlocking a mutex not owned by the calling thread).
- Violations of happens-before semantics in lock ordering.
While powerful, Helgrind is even slower than Memcheck and can generate false positives – particularly in code that uses custom synchronization (e.g., lock-free algorithms, atomic operations, or thread-local storage). It works best with standard mutex/condition-variable patterns.
In practice, Memcheck and Helgrind are the two Valgrind tools most frequently used in QA workflows – the former for memory safety, the latter for basic thread-safety validation.
Conclusion
For QA engineers validating C/C++ applications, Valgrind remains a cornerstone tool. It uncovers critical defects that evade conventional testing – including subtle memory leaks, buffer overruns, use-after-free errors, and uninitialized memory access – all without requiring source code or recompilation.
Its flexibility enables precise control over analysis depth and output:
- Tune instrumentation to balance execution speed and diagnostic coverage.
- Filter error types to suppress noise from third-party libraries.
- Use suppression files to silence known false positives.
- Route reports to structured log files for automation and regression tracking.
When applied effectively, Valgrind helps:
- Prevent gradual memory bloat in long-running services.
- Reduce elusive, hard-to-reproduce crashes.
- Improve system stability and resource predictability.
- Pinpoint defects that developers struggle to isolate without runtime insight.
Modern compilers offer AddressSanitizer (-fsanitize=address in GCC/Clang), a faster alternative (~1.5-2x runtime overhead vs. Valgrind's 10-50x) with excellent leak and memory-error detection. However, ASan requires instrumented builds – making it impractical for black-box testing of:
- Closed-source binaries.
- Third-party SDKs or vendor libraries.
- Production builds without debug symbols.
In these scenarios – where QA operates without access to source or build pipelines – Valgrind's ability to analyze binaries as-is ensures it remains indispensable, even today.